Patient-Centric, Smart Quality Controls for Immunoassays
Patient-Centric, Smart Quality Controls for Immunoassays
In 2022, an updated version of ISO15189 was released, placing an emphasis on risk management with the aim of mitigating risk to patients. This updated document means that rigorous quality control (QC) procedures are more important than ever.
ISO15189:2022 cites the use of third-party controls with commutable matrices manufactured to provide concentrations close to clinical decision limits, among others, as crucial considerations. ISO15189:2022 also highlights the importance of identifying and minimising errors in the pre-analytical process. ‘Load & Go’ or ‘Smart’ quality controls are becoming increasingly popular in laboratories around the world to realise this objective.
Smart controls are designed to optimise laboratory workflows, allowing laboratorians to load the control onto an instrument where it can remain until its expiry date, bringing several advantages to laboratories who run immunoassays.
The first is the minimisation of human error and other pre-analytical errors. As these controls are ready-to-go out of the box, there is no chance of reconstitution errors which can result in deviations from target values and contamination which could lead to problematic cross-reactions. Smart quality controls reduce the risk of stability issues resulting from aliquoting or the repetitive opening of vials, and eliminate the possibility of mislabelled controls, while freeing up more storage space.
Smart controls also offer the possibility of improvements in other areas of the laboratory. The reduction in the preparation required for these controls allows laboratories to use this time improving other elements of their QC practices, such as QC analysis and process improvement. Less steps in the QC process not only means time saved in the process itself, but less paperwork for laboratory staff, further freeing up time for more useful practices.
Immunoassay Smart quality controls provide laboratories with an effective QC solution which aids in the optimisation of workflows and the reduction of test turnaround times and the risk of human error throughout the QC process. However, if considering a Smart quality controls for your laboratory, its important to remember the other factors which make a good QC including matrix, stability, and clinically relevant concentrations.
The New Acusera Smart range has been designed to streamline workflows, minimise human error and reduce the strain on your cold storage. The convenient design means these controls can be loaded directly onto the analyser allowing the automation of the QC process, reducing turnaround times and increasing efficiency.
As well as the Immunoassay control, the Acusera Smart range also includes Clinical Chemistry, Liquid Cardiac and Parathyroid Hormone controls. We offer two options: Acusera SmartScan and Acusera SmartLoad. Take a look at the graphic below for more details.

We will be adding more controls to our Smart range soon. To stay up to date with this and all our other product releases, join our mailing list.
If you’d like some more information on any of the products in the Acusera range, don’t hesitate to get in touch. You can contact us at marketing@randox.com.
A Peculiar Problem in Pregnancy and the Placenta
Complications and Diagnosis of Pre-eclampsia
When we consider our most important organ its intuitive to choose the heart, the lungs or even the kidneys. However, there’s another without which none of us would be here to have the discussion. This ephemeral organ provides us with the nutrients necessary for development, removes malevolent agents, provides our initial immunity and much more, before being cast off as we enter the world. We are, of course, talking about the placenta. Indeed, all our organs work together to support life and it’s arbitrary to imbue one with more importance than the others. Nevertheless, as our first organ, the significance of the placenta is irrefutable.
Placental dysfunction, along with several other factors, is known to contribute to the development of pre-eclampsia – a complex, multisystem hypertensive disorder of pregnancy. While the aetiology of pre-eclampsia remains largely unknown, the grave complications associated with it have driven development of novel methods for predicting its onset.
Pre-eclampsia and Epidemiology
Pre-eclampsia is traditionally defined as new onset hypertension and proteinuria in pregnancy1, however, the International Federation of Gynaecology and Obstetrics’ (FIGO) clinical definition describes it as sudden onset hypertension (>20 weeks of gestation) and at least one of the following: proteinuria, maternal organ dysfunction or uteroplacental dysfunction2. It is responsible for an estimated 70’000 maternal deaths, and 500’000 foetal deaths globally3. Pre-eclampsia affects around 4% of pregnancies in the US and is more common in low-to-middle income countries (LMICs), displaying an overall pooled incidence of 13% in a cohort from sub-Saharan Africa4. The risk factors for pre-eclampsia are shown in the graphic below.

Pre-eclampsia is associated with increased morbidity and mortality worldwide. In the US, pre-eclampsia is the foremost cause of maternal death, severe maternal morbidity, maternal intensive care admissions and prematurity5.
Classical classification of pre-eclampsia included early-onset (<34 weeks gestation) and late-onset (>34 weeks gestation). However, this classification lacks clinical utility as it does not accurately illustrate maternal or foetal prognosis. Therefore, the International Society for the study of Hypertension in Pregnancy (ISSHP) and contemporary studies prefer to classify pre-eclampsia as preterm (delivery <37 weeks of gestation), term (delivery ≥37 weeks of gestation) and postpartum pre-eclampsia (after delivery).

Complications
Pre-eclampsia has been associated with acute and chronic complications for both mother and child. Worldwide risk of maternal and foetal morbidity displays adjusted odds ratios of 3.73 and 3.12, respectively (pre-eclampsia vs non pre-eclampsia)6.
Acute Maternal Complications
A range of neurological complications are associated with pre-eclampsia. The most obvious is eclampsia, defined as seizures in pregnant women commonly from 20 weeks of gestation or after birth7. Eclampsia has two proposed mechanisms: abnormal placentation reduces blood supply and causes oxidative stress, leading to endothelial damage; and elevated blood pressure in pre-eclampsia disrupts cerebral vasculature, causing hypoperfusion and damage8. In high-income countries (HICs), most women make a full recovery, however, more severe cases of eclampsia can result in permanent disability or brain damage7.
Stroke is a significant complication of pre-eclampsia, constituting 36% of strokes related to pregnancy9. The hypertension characteristic of pre-eclampsia can weaken the walls of blood vessels causing subarachnoid or intracerebral haemorrhage resulting in haemorrhagic stroke. Ischaemic stroke is also of concern due to blood clotting complications which will be discussed later.
Additonal neurological complications include visual scotoma, cortical blindness, cerebral venous sinus thrombosis, cerebral vasoconstriction syndrome and posterior reversible encephalopathic syndrome (PRES). Notably, the last three in this list frequently manifest postpartum without warning6.
HELLP (Haemolysis, Elevated Liver enzymes and Low Platelets) syndrome is a liver and blood clotting disorder and life-threatening complication of pre-eclampsia. HELLP syndrome most commonly presents immediately postpartum but can manifest any time after 20 weeks of gestation7. Microangiopathy, or small blood vessel disorder, leads to ischaemia and a subsequent increase in oxidative stress and inflammation, causing an increase in liver enzymes and participates in the initiation of HELLP. Thrombocytopenia, or platelet deficiency, is considered a product of platelet depletion resulting from heightened platelet activation triggered by widespread endothelial damage6.
Another blood clotting condition associated with pre-eclampsia is Disseminated intravascular coagulation (DIC)7, described as the dysfunction of the maternal blood clotting system resulting in multiple organ dysfunction syndrome10. DIC can cause excessive bleeding due to lack of clotting proteins, or the formation of clots due to overactive clotting proteins, ultimately causing organ damage10.
As described earlier, proteinuria is included in the diagnostic criteria for pre-eclampsia, suggesting involvement of the kidneys. This is caused by high concentrations of soluble FMS like Tyrosine kinase 1 (sFLT-1), a placental angiogenic factor, which inhibits proteins of the podocyte slit diaphragm6; the machinery involved in preventing the leakage of proteins into the urine11. Reduced levels of Vascular Endothelial Growth Factor (VEGF) and Placental Growth Factor (PlGF) stimulates Endothelin 1 expression6, known to promote podocyte detachment, further contributing to proteinuria12.
Finally, Pulmonary oedema, excessive fluid accumulation in the lungs, is an acute and life-threatening complication associated with pre-eclampsia, the likelihood of which is increased via administration of antihypertensive medications6.
Acute Neonatal Complications
There are several documented complications affecting the baby of a pre-eclamptic mother. Firstly, Intrauterine growth restriction (IUGR) can result in underdevelopment of the foetus because of deficient transfer of oxygen and other nutrients from mother to child13. This can result in low birth weight, particularly when pre-eclampsia occurs prior to 37 weeks of gestation7. In pre-eclampsia with severe symptoms, delivery frequently occurs prematurely, either spontaneously or through induction. Preterm delivery can result in complications such as neonatal respiratory distress syndrome and neonates often require ICU admission7. Additionally, there is increased risk of stillbirth in pre-eclamptic pregnancies with relative risk shown to be 1.45 (95% Cl 1.20-1.76)14. Other complications documented in neonates born through pre-eclamptic pregnancies include neonatal thrombocytopenia, bronchopulmonary dysplasia, and a range of neurodevelopment outcomes15.
Long-term Complications
The only known cure for pre-eclampsia is delivery. However, the complications for both mother and child can last long after even an uncomplicated delivery. After a pre-eclamptic pregnancy, women are increased risk of end stage renal disease (4.7-fold), stroke (4-fold) and vascular dementia (3-fold) later in life5. Women are also at increased risk of other cardiovascular disease (CVD) including chronic hypertension, coronary artery disease, congestive heart failure5, and ischaemic heart disease13. In offspring, IUGR increases the risk of development of hypertension and other CVD13. Finally, offspring have been shown to be at higher risk of increased body mass index, changes in neuroanatomy, reductions in cognitive function, and hormonal abnormalities13.

sFLT-1/PlGF ratio
The pathophysiology of pre-eclampsia is complex and enigmatic. However, placental dysfunction is known to be a factor in pre-eclampsia development. The placental-related angiogenic factors, sFLT-1 (anti-angiogenic) and PlGF (pro-angiogenic), have been implicated in this development. This ratio provides a useful measure of placental dysfunction as a sharp increase in sFLT-1 and decrease in PlGF has been shown approximately 5 weeks before onset of pre-eclampsia16.
Until recently, diagnosis of pre-eclampsia was one of clinical manifestation. However, studies such as PROGNOSIS17 and PROGNOSIS Asia18, along with others19,20, have shown strong utility of this ratio. The PROGNOSIS study showed that a ratio cutoff of ≥38 was useful for ruling out pre-eclampsia within 1 week with a negative predictive value (NPV) of 99.3% or 4 weeks with a positive predictive value (PPV) of 36.7%17. The definitions of pre-eclampsia used by ICCHP and American College of Obstetricians and Gynaecologists (ACOG) have a PPV of around 20%, but when used in combination with the sFLT-1/PlGF ratio, the PPV is enhanced to 65.5% for ruling in pre-eclampsia within 4 weeks.21.
Similar results have been shown in an Asian cohort in the PROGNOSIS Asia Study. Using the same cutoff value, this study reported an NPV of 98.9%18. Furthermore, in a sub analysis of this cohort that looked at Japanese participants, a cutoff of ≥38 displayed an NPV of 100% for ruling out pre-eclampsia within 1 week and a PPV of 32.4% for ruling in within 4 weeks22.
Accurate Identification is Essential
Like all clinical assays, those used to determine the sFLT-1/PlGF ratio are subject to rigorous quality control, essential to ensure accurate results and diagnosis. The complications of pre-eclampsia are severe and often life-threating for both mother and child. Early and accurate identification is imperative for optimal monitoring, management, and timely interventions to reduce the risk of the grave consequences associated with pre-eclampsia.
The utility of the sFLT-1/PlGF ratio has been shown over various large cohorts and provides improved identification when used in combination with established clinical definitions. While the enigma of pre-eclampsia persists, the dedication of the scientific community to unravel its complexities ensures a future where expectant mothers may benefit from more effective and tailored strategies to mitigate the risks associated with this puzzling condition. Continued research endeavours will undoubtedly shape the landscape of maternal-foetal medicine, fostering advancements that hold the promise of improved outcomes for both mothers and their unborn children.
At Randox Quality Control, we’ve introduced our Pre-eclampsia Control to the Acusera IQC range for use with in vitro diagnostic assays for the quantitative determination of PlGF and sFlt-1 in human serum and plasma.
Our true third-party Pre-eclampsia control comes with clinically relevant, assayed target values, is liquid-frozen for user convenience, utilises a human-based, commutable matrix, and has a 30-day open vial stability.
For more information on this, or any of our other controls, browse our brochure, or reach out to us today at marketing@randox.com for more information.
References
- American College of Obstetricians and Gynecologists; Task Force on Hypertension in Pregnancy. Hypertension in Pregnancy. Obstetrics & Gynecology. 2013;122(5):1122-1131. doi:10.1097/01.AOG.0000437382.03963.88
- Poon LC, Shennan A, Hyett JA, et al. The International Federation of Gynecology and Obstetrics (FIGO) initiative on pre‐eclampsia: A pragmatic guide for first‐trimester screening and prevention. International Journal of Gynecology & Obstetrics. 2019;145(S1):1-33. doi:10.1002/ijgo.12802
- Karrar SA, Hong PL. Preeclampsia. StatPearls Publishing; 2023.
- Jikamo B, Adefris M, Azale T, Alemu K. Incidence, trends and risk factors of preeclampsia in sub-Saharan Africa: a systematic review and meta-analysis. PAMJ – One Health. 2023;11. doi:10.11604/pamj-oh.2023.11.1.39297
- Rana S, Lemoine E, Granger JP, Karumanchi SA. Preeclampsia. Circ Res. 2019;124(7):1094-1112. doi:10.1161/CIRCRESAHA.118.313276
- Dimitriadis E, Rolnik DL, Zhou W, et al. Pre-eclampsia. Nat Rev Dis Primers. 2023;9(1):8. doi:10.1038/s41572-023-00417-6
- NHS. Pre-eclampsia. Health A to Z. Published September 28, 2021. Accessed January 3, 2024. https://www.nhs.uk/conditions/pre-eclampsia/complications/
- Magley M, Hinson MR. Eclampsia. StatPearls Publishing; 2023.
- Crovetto F, Somigliana E, Peguero A, Figueras F. Stroke during pregnancy and pre-eclampsia. Curr Opin Obstet Gynecol. 2013;25(6):425-432. doi:10.1097/GCO.0000000000000024
- Costello RA, Nehring SM. Disseminated Intravascular Coagulation. StatPearls Publishing; 2023.
- Kawachi H, Fukusumi Y. New insight into podocyte slit diaphragm, a therapeutic target of proteinuria. Clin Exp Nephrol. 2020;24(3):193-204. doi:10.1007/s10157-020-01854-3
- Trimarchi H. Mechanisms of Podocyte Detachment, Podocyturia, and Risk of Progression of Glomerulopathies. Kidney Dis (Basel). 2020;6(5):324-329. doi:10.1159/000507997
- Turbeville HR, Sasser JM. Preeclampsia beyond pregnancy: long-term consequences for mother and child. American Journal of Physiology-Renal Physiology. 2020;318(6):F1315-F1326. doi:10.1152/ajprenal.00071.2020
- Harmon QE, Huang L, Umbach DM, et al. Risk of Fetal Death With Preeclampsia. Obstetrics & Gynecology. 2015;125(3):628-635. doi:10.1097/AOG.0000000000000696
- Backes CH, Markham K, Moorehead P, Cordero L, Nankervis CA, Giannone PJ. Maternal Preeclampsia and Neonatal Outcomes. J Pregnancy. 2011;2011:1-7. doi:10.1155/2011/214365
- Verlohren S, Galindo A, Schlembach D, et al. An automated method for the determination of the sFlt-1/PIGF ratio in the assessment of preeclampsia. Am J Obstet Gynecol. 2010;202(2):161.e1-161.e11. doi:10.1016/j.ajog.2009.09.016
- Zeisler H, Llurba E, Chantraine F, et al. Predictive Value of the sFlt-1:PlGF Ratio in Women with Suspected Preeclampsia. New England Journal of Medicine. 2016;374(1):13-22. doi:10.1056/NEJMoa1414838
- Bian X, Biswas A, Huang X, et al. Short-Term Prediction of Adverse Outcomes Using the sFlt-1 (Soluble fms-Like Tyrosine Kinase 1)/PlGF (Placental Growth Factor) Ratio in Asian Women With Suspected Preeclampsia. Hypertension. 2019;74(1):164-172. doi:10.1161/HYPERTENSIONAHA.119.12760
- Hughes RCE, Phillips I, Florkowski CM, Gullam J. The predictive value of the sFlt‐1/PlGF ratio in suspected preeclampsia in a New Zealand population: A prospective cohort study. Australian and New Zealand Journal of Obstetrics and Gynaecology. 2023;63(1):34-41. doi:10.1111/ajo.13549
- Nikuei P, Rajaei M, Roozbeh N, et al. Diagnostic accuracy of sFlt1/PlGF ratio as a marker for preeclampsia. BMC Pregnancy Childbirth. 2020;20(1):80. doi:10.1186/s12884-020-2744-2
- Verlohren S, Brennecke SP, Galindo A, et al. Clinical interpretation and implementation of the sFlt-1/PlGF ratio in the prediction, diagnosis and management of preeclampsia. Pregnancy Hypertens. 2022;27:42-50. doi:10.1016/j.preghy.2021.12.003
- Ohkuchi A, Saito S, Yamamoto T, et al. Short-term prediction of preeclampsia using the sFlt-1/PlGF ratio: a subanalysis of pregnant Japanese women from the PROGNOSIS Asia study. Hypertension Research. 2021;44(7):813-821. doi:10.1038/s41440-021-00629-x
Meeting Accreditation Guidelines with Acusera 24.7
At Randox Quality Control, we are never finished shouting about how great our interlaboratory comparison and peer group reporting software is. If you’ve had a look yourself, you’ll know exactly why. Acusera 24.7 is full of fetching, interactive charts, and useful, detailed reports, including measurement uncertainty, to help you streamline your QC procedure.
But Acusera 24.7 is so much more than this. Our team are constantly looking for innovative ways to update and improve our live, cloud-based software. Much of this comes from talking to our subscribers and finding out what they want and how they want to do it. Our team also happens to include some serious accreditation enthusiasts. So, we decided to put their passion to work. We’re regularly coming up with new measures to make meeting the guidelines set out by various accreditation bodies, including ISO15189, as simple for you as we can.
In this article, we’ll look at some of the accreditation requirements and the features we’ve included in Acusera 24.7 to simplify the process for you.
QC management tools
Its one thing to look at the features of Acusera 24.7, but what do the various guidelines have to say about QC management tools? Let’s look at some of the major accreditation literature.
ISO15189:2022
The new version of ISO15189 includes updates which aim to place more emphasis on risk management and mitigating risk to the patient. Here’s what the 2022 version has to say about QC management tools:
The Clinical Laboratory Improvement Amendments 1988 (CLIA)
CLIA ’88 regulations are federal standards applicable to all U.S. facilities or sites that test human specimens for health assessment or to diagnose, prevent, or treat disease. These regulations state the following related to QC management:
COLA Accreditation
The Commission on Office Laboratory Accreditation (COLA) is another recognised laboratory accreditation in the U.S. and is a third-party accreditation organisation that ensures laboratories comply with federal regulations, including those set by CLIA. I’m sure you’re catching the trend here:
Meeting accreditation with Acusera 24.7
Acusera 24.7 offers a flexible approach to help laboratories meet all the QC accreditation requirements detailed above, including CLIA, COLA, CAP, and ISO15189.
Our user-friendly, cloud-based software allows users to effortless run statistical analysis including Coefficient of Variation Index (CVI), Standard Deviation Index (SDI), % Bias, Total Error, Sigma Metrics and more! Find out more about how we can aid you in your statistical analysis in our blog, Advanced Statistics with Acusera 24.7.
Acusera 24.7 can also create fully interactive Levey-Jennings charts, and a selection of histograms to provide a wide range of options for the graphical representation of your data. The interactive features of our charts allow you to record events such as lot changes and calibration events directly on to the chart, helping you achieve not just accreditation, but a better understanding of what is going on in your laboratory. You can read more about our charts and the insights you can gain from them at our blog, Charting the course to laboratory excellence.
Acusera 24.7 can also provide you with a variety of reports to help you effortlessly achieve accreditation. From our Statistical Analysis and Exception reports to our Personalised Performance Summary Reports, we can help your laboratory to efficiently identify and document trends or shifts in performance. You can read all about our reports in our blog, Effortless Data Management: Acusera 24.7 Reports.
Measurement Uncertainty
Anyone involved in laboratory quality control will be aware of measurement uncertainty (MU), although that doesn’t mean everyone understands this tricky requirement. MU is defined as a parameter associated with the result of a measurement that characterises the dispersion of values that could reasonably be attributed to the measured quantity.
In other words, MU provides medical laboratories with an estimate of the overall variability in the values they report. The goal of MU is to quantify the doubt or range of possible values around the measurement result, helping to provide an understanding of the reliability and limitations of measurements. This helps ensure measured results are useful and not wildly inaccurate, allows meaningful comparisons with medical decision limits and previous results of the same kind in the same individual and finally, it’s a requirement of ISO15189:2022:
Calculating MU is no simple task and not one that can even be attempted without in depth know-how. These calculations can take a single member of staff 2 full working days to complete. That’s a lot of time away from their normal duties, especially if MU is to be reviewed regularly, as per ISO15189:2022.
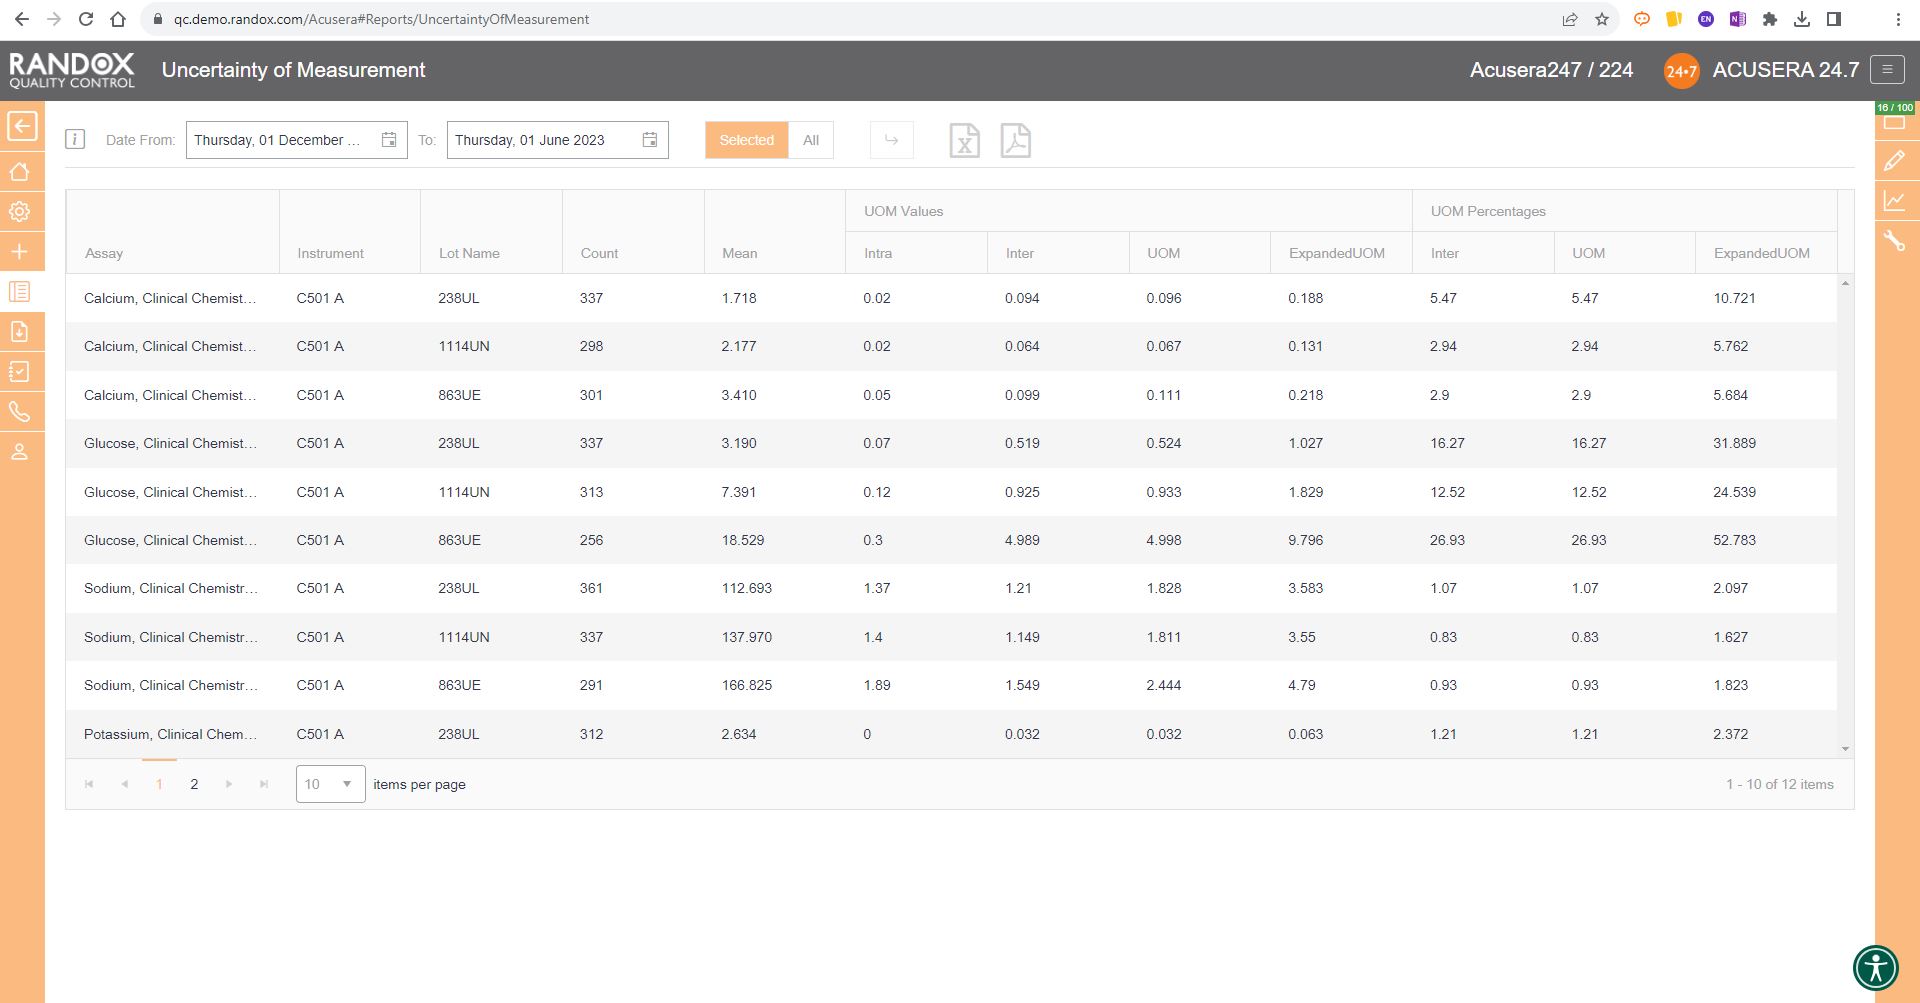
Lucky for you, Acusera 24.7 can calculate you MU in seconds, rather than days, and provide you with a report. This report can be shown to your accreditation surveyor, and you can consider the MU box ticked. You can read more about Acusera 24.7 and MU in our Advanced Statistics blog, or in our educational guide How to Measure Uncertainty.
Peer Group Reporting
The peer group reporting features of Acusera 24.7 are much more than just an added extra. Peer group reporting can help speed up the troubleshooting process, allowing you to determine whether an issue you are seeing is unique to you, or evident in the QC data of your peers. It can also provide you with more confidence in assigned target values and help make significant savings by improving your analytical performance, and therefore, your EQA performance.
A peer group reporting programme can also help meet regulatory requirements, like ISO15189:2022:
So, if you’re struggling to find a suitable EQA programme for your analytes, you might just be able to meet your accreditation with the peer group reporting features included in Acusera 24.7.
We’ve only begun to cover the features of this intuitive and efficient software. If you still aren’t convinced that Acusera 24.7 is right for QC data management in your laboratory, reach out to us today at marketing@randox.com. We’re always delighted to hear from you, and we’ll be happy to discuss any of the features of Acusera 24.7, or any reservations you may have.
Our customers can’t believe the gulf in class between Acusera 24.7 and other QC data management programmes.
Don’t get left behind.
Reach out to us today!
International Day of Women and Girls in Science 2024
For the 9th consecutive year, the field of science has taken this day to celebrate women in the STEM industries and their achievements. The representation of women in STEM is climbing, however it remains low, with estimates claiming women make up only around 26% of the workforce. By celebrating the accomplishments of women in these fields, we hope to encourage more girls to enter the world of science and engineering and challenge the adversity women in STEM all too often face.
In honour of International Day of Women and Girls in Science 2024, we’ve looked at some of the most important achievements in the life sciences. Some of the names you’ll be familiar with, others may be new. We’ll travel to Ancient Greece where we will learn about the first female science writer and surgeon, before coming back to today to recognise some of the most groundbreaking innovations in medicine. For far too long the door to a career in the life sciences has been all but closed for women, as you will discover in this article. Yet some of the discoveries and triumphs over adversity we’ll look at are arguably some of the most important achieved by humanity.
Metrodora
In Ancient Greece, it was believed that science was derived directly from the gods. This meant, like other divine disciplines, women were not allowed to practice medicine. However, such a technicality did not stop our first heroine of science. Before her exploits in Greece, Metrodora was likely born and educated in Egypt where men and woman were equals, unlike much of the ancient world. In fact, some believe Metrodora to be an alias of the famous Cleopatra VII, Queen of Egypt. There is some debate about when Metrodora lived; some say between 200-400 CE, others claim it was more likely to be during the 7th century CE. The name Metrodora is particularly fitting for a woman of her accolades. In Greek, metro can be translated as womb, and dora means gift.
Metrodora was the author of a textbook, making her the first female science writer, spanning 2 volumes and 108 chapters entitled On the Disease and Cures of Women, in which she describes in detail her theories and findings on the topics of female health and the reproductive system. She is thought to have devised treatments for sterility, infections of the female reproductive system, menorrhagia (heavy periods) as well as a method for determining sexual abuse in women. Not to be limited by writing and medicine, Metrodora was also a surgeon, cited as removing dead embryos to save the lives of mothers who miscarried, removing cancers of the breast and uterus and was even among the first to perform cosmetic surgery. Metrodora reconciled this with her Hippocratic duty to help women who had been abused through aesthetic facial and breast reconstruction and the restructuring of the hymen of women who had suffered this fate.
Her pioneering work, however, was quite nearly forgotten forever as she was largely overlooked by her contemporaries. But thankfully, some of her texts are preserved in the Laurentian Library in Florence. Metrodora’s commitment to medicine and female health is summed up perfectly in the opening words of her text, “some of them are intricate to treat and others are fatal, by these notes we will recognise each one”.

Elizabeth Blackwell (1821-1910)
Elizabeth Blackwell was always destined to shake the status quo. Her father, Samuel, was a Quaker and an antislavery activist. Among her siblings are Henry, an abolitionist and women’s suffrage supporter; her sister, Emily, who followed Elizabeth into medicine; and her sister-in-law, Antoinette Brown Blackwell, who was the first female minister in mainstream Protestantism.
She was inspired into a life of medicine after a close friend had confessed embarrassment of her treatment by male doctors and suggested she’d have been more comfortable if attended to by a female physician. After a series of rejections from numerous medical schools, Elizabeth was finally accepted to Geneva College, New York. However, this acceptance was intended as a practical joke. Not to be discouraged, Elizabeth proved them all wrong, graduating top of her class in 1849 and becoming the first woman to graduate medical school. Dr Blackwell then practiced in London and Paris and was one of the first advocates for the importance of hygiene in medicine, noting that male doctors frequently failed to wash their hands, which led to the spread of epidemics.
In 1851, Elizabeth made the trip back to New York where discrimination was still rife. Once again, her persistence led to the opening of the New York Infirmary for Women and Children in 1857 with Dr Emily Blackwell and Dr Marie Zakrzewska. This institution was a haven for women who needed medical treatment but were often too poor to afford it, and for female physicians struggling to get work in the field. Among her laurels, she played a role in the inception of the National Health Society, established in 1871, which aimed to spread knowledge of public health, and is considered the predecessor to the National Health Service.

Marie Curie (1867-1934)
Marie Curie is among the most famous of the women in science, so we won’t spend too much time on her life and accomplishments here. However, its impossible to have the discussion without mentioning her invaluable contribution to science. In often poor laboratory conditions with worse equipment, she, and her husband Pierre Curie, made some pivotal discoveries including the isolation of polonium and radium. Marie Curie developed techniques to separate radium from radioactive residues which allowed it to be studied extensively and eventually, its use as a therapeutic agent.
In 1903, Marie and Pierre Curie were awarded half of the Nobel Prize for Physics for their work on spontaneous radiation. Then, in 1911, Marie Curie was given a second Nobel Prize, this one for chemistry, for her work on radioactivity. In recognition of her groundbreaking work leading to novel cancer therapies, the charity Marie Curie was named in her honour, immortalising her and her contributions to the field.

Gerty Cori (1896-1957)
Here we find another woman whose name outshines that of her husband, Carl, with whom she collaborated for most of her scientific career. Gerty graduated from medical school in 1920, along with her husband, before they emigrated to America in 1922. Here, they initially delved into the fate of sugar within the animal body, exploring the impacts of insulin and epinephrine. They made groundbreaking discoveries, including the demonstration of glycolysis in tumours in vivo. Their research on carbohydrate metabolism evolved from whole animal studies to experiments on isolated tissues, and eventually to tissue extracts and isolated enzymes, including some in crystalline form. In a pivotal moment in 1936, they isolated glucose-1-phosphate, known as “Cori ester,” and linked its formation to the activity of phosphorylase, which plays a crucial role in the breakdown and synthesis of polysaccharides. This discovery paved the way for the enzymatic synthesis of glycogen and starch in vitro.
Their research extended into the realm of hormone action mechanisms, with several studies focusing on the pituitary gland. They observed significant changes in rats that have had their pituitary gland removed, including a marked decrease in glycogen and a drop in blood sugar levels, accompanied by an increased rate of glucose oxidation. Further investigations into the effects of hormones on hexokinase revealed that certain pituitary extracts could inhibit this enzyme both in vivo and in vitro, while insulin was found to counteract this inhibition.
Beyond their groundbreaking research, the Cori’s served as an endless source of inspiration to their peers in the vibrant hubs of biochemical research they led. Their contributions to The Journal of Biological Chemistry and numerous other scientific journals have left an indelible mark on the field, showcasing their innovative work and collaborative spirit throughout their careers.

Gertrude Belle Elion (1918-1999)
Gertrude provides us with another tale of the triumph over adversity. After graduating with a degree in biochemistry in 1937, she failed to obtain a graduate position because she was a woman. After roles in laboratories and teaching, she joined the Burroughs Wellcome Laboratories in 1944 and became the assistant to Dr George Hitchings. Over the following 40 years, the pair were successful in the development of a vast array of new drugs and treatments. Much of their success is attributed to their methods. At the time, normal practice is best described as trial and error. However, Hitchings and Elion studied and intimately understood the difference between normal and pathogenic biochemistry, allowing them to envision and create targeted treatments for, to name just a few, leukaemia, urinary-tract infection, gout, malaria and viral herpes.
Although she never achieved her doctorate, in 1967 Elion was promoted to Head of the Department of Experimental Therapy, where she remained until her retirement in 1983. But Elion didn’t let a silly old thing like retirement get in her way. She remained at the Burroughs Wellcome Laboratories as a Scientist Emeritus and Consultant, including overseeing the development of azidothymidine, the first drug used to treat AIDS. Elion also became a Research Professor of Medicine and Pharmacology at Duke University, working with medical students in the field of tumour biochemistry and pharmacology, while continuing to write and lecture. Gertrude B. Elion passed away in 1999, bringing an end to a happy and fruitful career as one of the most influential women in science.

Rosalind Franklin (1920-1958)
Rosalind Franklin, another well-known name and one synonymous with the discovery of the DNA double helix, was an exceptional scientist whose meticulous work in X-ray crystallography laid the groundwork for one of the 20th century’s most significant scientific discoveries. Franklin graduated from Cambridge University in 1941, where she initially delved into the study of coal, gases, and carbon compounds, significantly contributing to the understanding of the molecular structures of these materials. Her early research not only showcased her exceptional skills in physical chemistry but also set the stage for her pioneering work in biology.
In 1951, Franklin joined King’s College London, where she was tasked with improving the X-ray crystallography unit. It was here that Franklin embarked on her most famous work: the study of the structure of DNA. Using her expertise in X-ray diffraction techniques, she captured Photograph 51, a critical piece of evidence revealing the helical structure of DNA. This image was crucial in identifying the double helix structure, although her contributions were not fully acknowledged until after her death.
Franklin’s research extended beyond DNA to the study of viruses, making significant strides in understanding the polio virus and the tobacco mosaic virus. Her work in virology, much like her work on DNA, was pioneering, employing her crystallography skills to uncover the detailed structure of viral particles. This work provided valuable insights into how viruses replicate and infect cells, contributing to the broader field of virology and paving the way for future research in virus structure and function.
Despite facing considerable challenges as a woman in a predominantly male scientific community, Franklin’s contributions were profound. Her relentless pursuit of scientific truth, combined with her exceptional experimental skills, left a legacy in the fields of chemistry, virology, and genetics. Beyond her scientific achievements, Franklin is remembered as a trailblazer who paved the way for future generations of women in science, demonstrating the critical role of perseverance and dedication in the pursuit of knowledge.

Françoise Barré-Sinoussi (1947-)
When discussing women who changed science, it’s impossible not to mention Françoise Barré-Sinoussi. She was born in Paris in 1947 and attended university there. Her passion for science saw her skip class to work at the Pasteur Institute, participating in investigations of retroviruses that caused leukaemia in mice. Although, this didn’t seem to affect her exams scores, and she received her PhD in 1974.
Françoise Barré-Sinoussi is hailed as the woman who discovered the viral cause of the AIDS epidemic. In 1982, the Pasteur Institute was approached by a virologist from a hospital in Paris, seeking help in identifying the cause of a worrying new epidemic. In a mere 2 weeks, Barré-Sinoussi, and her colleagues at the Pasteur Institute, isolated and grew a retrovirus from a biopsied lymph node of a patient at risk of AIDS. The virus, later named HIV-1, was found to be the cause of the AIDS epidemic.
Barré-Sinoussi has been contributing to virology research ever since, including areas such as the function of the host’s innate immune defences in managing HIV/AIDS, the elements contributing to the transmission of HIV from mother to child, and traits enabling a select group of HIV-positive individuals to restrain HIV replication without the need for antiretroviral medications. In 1992, Barré-Sinoussi was appointed Head of the Biology of Retrovirus Unit, renamed the Regulation of Retroviral Infections Unit in 2005.
However, Barré-Sinoussi didn’t stop at the science. She became a prominent activist for public education about AIDS prevention and helped to establish centres for diagnosing and treating AIDS around the world. In 2006, Barré-Sinoussi was elected to the International AIDS Society (IAS) Governing Council and served as president of the IAS from 2012-2016.

Jennifer Douda and Emmanuelle Charpentier
Most people have heard of CRISPR-Cas9. But many aren’t aware that we have women to thank for this scientific innovation. In 2012, Jennifer Douda (left) and Emmanuelle Charpentier (right) discovered the ingenious CRISPR-Cas9 technology – a groundbreaking tool in genetic engineering, which holds the promise of revolutionising medicine and biology. By enabling precise editing of the DNA in the cells of living organisms, CRISPR-Cas9 could lead to cures for genetic disorders, enhance crop resistance to pests and diseases, and advance our understanding of complex genetic conditions. It offers the potential to correct genetic defects, combat infectious diseases, and even manipulate traits in plants and animals, paving the way for significant advancements in therapeutic treatments, agricultural productivity, and the study of genetics. This discovery saw both women share the Nobel Prize in Chemistry in 2020.


We’ve only looked at a subsection of science, but one where the importance of the innovations and discoveries is felt by people every day. The scientists we’ve discussed here are only a small sample of the inspirational women that have graced the STEM field. We hope that by elucidating some of their work, we can inspire more girls and women to pursue a career in STEM. Careers in this field are challenging and rewarding, perfect for those with a curious mind and those in whom discovery sparks delight.
UKAS ISO15189:2022 Transition Update
Throughout 2023, UKAS have been hard at work training Assessment Managers and Technical Assessors on the new requirements of the updated ISO15189 guidelines, sharing information about the updated standard and developing the UKAS 15189:2022 Transition Hub providing a one-stop-shop for information on the ISO15189:2022 update.
Recently, UKAS have published a Transition update to remind laboratories of where they stand in seeking their updated accreditation. In this update, UKAS state “As per the UKAS transition plan, all assessments due to take place from the 1st January 2024 will be to ISO15189:2022.”
A gap analysis will be required one month prior to transition assessments, detailing the gaps and the actions which have been taken to remedy these gaps. This should include evidence, such as updated documents and records, embedded in the gap analysis document, showing what action has been taken to bring a laboratory’s practices in line with the updated standard.
An important note included in this transition update is , “UKAS cannot grant accreditation on intent; organisations shall make the necessary changes and have implemented these prior to the transition assessment.” So if your accreditation assessment is due soon, you might want to make use of our ISO15189:2022 Accreditation Guide to assist you in your gap analysis to ensure you don’t miss out.
This is crucial for laboratories because failure to align with the 2022 version of the standard before the deadline of 6th December 2025 will result in a suspension of ISO15189 accreditation for up to 6 months.
Some of the key accreditation updates include:


Randox Quality Control’s Acusera range provides true third part quality controls designed to help you achieve all aspects of ISO15189:2022 accreditation including commutable matrices containing consistent, clinically relevant concentrations with unrivalled consolidation of analytes. To learn more about our range of quality control products, visit our website or, get in touch today at marketing@randox.com
Advanced Statistics with Acusera 24.7
The only thing that sounds more terrifying than statistics, is advanced statistics. For many of us, the dread associated with having to carry out complex calculations can be too much to bear. For others, statistics are not just a set of numbers; they’re a captivating puzzle waiting to be solved. The allure of dissecting intricate patterns, unravelling hidden relationships, and drawing meaningful conclusions makes these statistical enthusiasts embrace the challenges of advanced statistics with excitement rather than apprehension.
No matter which camp you’re in, we bet you’re going to love the advanced statistics features included in Acusera 24.7. From Uncertainty of Measurement to Sigma Metrics, we’ve got you covered. Let’s explore these features and how we can make your statistical analysis easier than ever before.
Measurement Uncertainty
If you’re involved in laboratory quality control, you’ll have heard all about measurement uncertainty (MU). To some it’s intuitive. To some it’s a labyrinth. MU is defined as a parameter associated with the result of a measurement that characterises the dispersion of values that could reasonably be attributed to the measured quantity. For example, if we say the pencil below measures 16cm ± 1cm, at the 95% confidence level we are really saying that we are 95% sure that the pencil measures between 15cm and 17cm.

In other words, the calculation of MU gives medical laboratories an estimate of the overall variability in the values they report. This is important for 3 reasons:
- It helps ensure the measured results are useful and not wildly inaccurate.
- It permits meaningful comparison of medical decision limits and previous results of the same kind in the same individual.
- It’s a regulatory requirement – ISO 15189:2022
All measurements involve some degree of inherent variability due to factors such as instrument limitations, environmental conditions, and biological variation. MU aims to quantify the doubt or range of possible values around the measurement result, helping to provide an understanding of the reliability and limitations of measurements. To complete this task comprehensively, the entire measurement process must be examined and should consider components such as systematic errors, random errors and uncertainties related to calibration, equipment, and the environment.
ISO 15189:2022 states:

So, if you are seeking ISO15189 accreditation, there’s no avoiding MU and advanced statistics. Lucky for you, Acusera 24.7 can calculate MU and provide you with a report which you can export to Excel or PDF for auditing or archiving.
By liberating you from the need to manually calculate MU for all your assays and control levels, Acusera 24.7 streamlines the statistical analysis process, freeing you up to complete your other essential duties. It also helps reduce the chance of errors in the calculation; after all, no matter how talented you are at mathematics, we all make mistakes. The real-time nature of this kind of monitoring means you don’t have to recalculate every time you get more data – simply press the refresh button and you’ll automatically get a new MU report.
By incorporating automated tools to calculate MU, you gain the ability to proactively pinpoint and rectify potential error sources, mitigating the risk of inaccurate measurements and the repercussions that may follow.

For more information on MU and how it’s calculated, see our education guide – How to Measure Uncertainty.
Sigma Metrics
The Sigma model was originally developed for the manufacturing industry as a method of process improvement focusing on minimising errors in process outputs. It has since been adopted by the medical laboratory to improve result reporting.
This model calculates the number of standard deviations or ‘Sigmas’ that fit within the quality specifications of the process – as the sources of error or variation are removed, the standard deviation becomes smaller, and the sigma score increases – 6 being the target. A 6 Sigma process can be expected to produce 3.4 defects, or false results, per million.

Using your predetermined performance limits, including biological variation (standard), RiliBÄK and CLIA, as the total allowable error (TEa), Acusera 24.7 can calculate a Sigma Score for a particular assay, method, or instrument, saving you the hassle of calculating this manually – freeing you up to investigate the sources of error and make improvements to your process.
This is displayed in our Statistical Metrics report along with Count, Bias%, and CV for your chosen range, your cumulative results and those from other Acusera 24.7 users from around the world to provide straightforward and comprehensive statistical analysis and peer group comparison.

Once you’ve found out your Sigma Score for an assay, you can use this to determine your QC frequency and the multi-rules you should apply to your QC. The higher your Sigma Score, the less multi-rules you need to apply to your analysis and the less often you need to run QC for that assay. The table below shows the multi-rules and QC frequencies associated with each Sigma Score.

Acusera 24.7 includes multi-rule capabilities that can be utilised to monitor your QC data and index it as accepted, rejected, or trigger an alert, depending on the pre-defined multi-rules against which you want to check your data. These features enable the identification of nonconformities and reduce the need for laborious manual statistical analysis while enhancing the accuracy and precision of the laboratory. To read more about the multi-rule features of Acusera 24.7, take a look at our educational guide – Understanding QC Multi-rules.

Now that we’ve found which of our assays are underperforming, we can begin to take corrective action. The Sigma Score is affected by bias and imprecision of laboratory results, therefore improving these values will increase the Sigma Score. Some of the steps a laboratory can take are:
- Improved staff training
- Instrument maintenance
- Frequent calibration
- Strict adherence to SOPs when preparing controls and calibrators.
If you are still in the dark ages, carrying out your statistical calculations and analysis manually, reach out to us today to learn more about the time and expense we can help you save. Every day, more people are discovering the power of Acusera 24.7 and the benefits it has in their laboratory.
The updates to ISO151589:2022 are based around increasing patient safety and reducing erroneous results, making advanced statistics essential. Assessors get excited when they see Acusera 24.7 in the lab because they know quitting time is that bit closer. Allow us to help you achieve your accreditation and provide the best possible patient care. With complete onboarding assistance and first-class customer support, you’ll always be ready to get to the bottom of any problems you might face. Get in touch today at marketing@randox.com
Effortless Data Management: Acusera 24.7 Reports
You’ve carried out your daily maintenance and run your IQC. You’ve got your results and now it’s time to type them up into one of your expansive spreadsheets. Reports
You’ve probably got your spreadsheet set up to calculate the required parameters already, but what if there’s an error in the formula? Or what if you make an error when entering your data? Or worse, what if you try to open the spreadsheet only to find that the file is corrupted or lost? If your Excel file is there, someone else might already be editing it, meaning you must wait until they’re finished before you can make any changes.
Even if you face none of these obstacles the labour-intensive statistics needed for performance review and validation might just keep you up at night.
Well, with Acusera 24.7, these concerns are history.
Whether you make use of our automated or semi-automated data entry options, you can be sure that the data put into the system is exactly that returned by your instrument. If you use the manual data entry option, we can’t remove the human error element – but with our simple and intuitive interface, we trust you’ll be flawless anyway. What’s more, the cloud-based nature of our software also means you won’t lose the data by mistake and unique access for each user allows multiple people to be logged in at the same time.

So, what next?
Well, you can view this data on our dashboard for fast and easy access to your results but delve a little deeper into Acusera 24.7 and you can access comprehensive, easy-to-read, customisable, reports designed to speed up the review process.
These reports include statistical analysis, exception reports, peer group statistics, uncertainty of measurement and advanced statistical metrics. The latter two we’ll look at in a dedicated article. For the others, however, let’s dive in and see how you could benefit from our range of extensive reports.
Statistical Analysis Reports
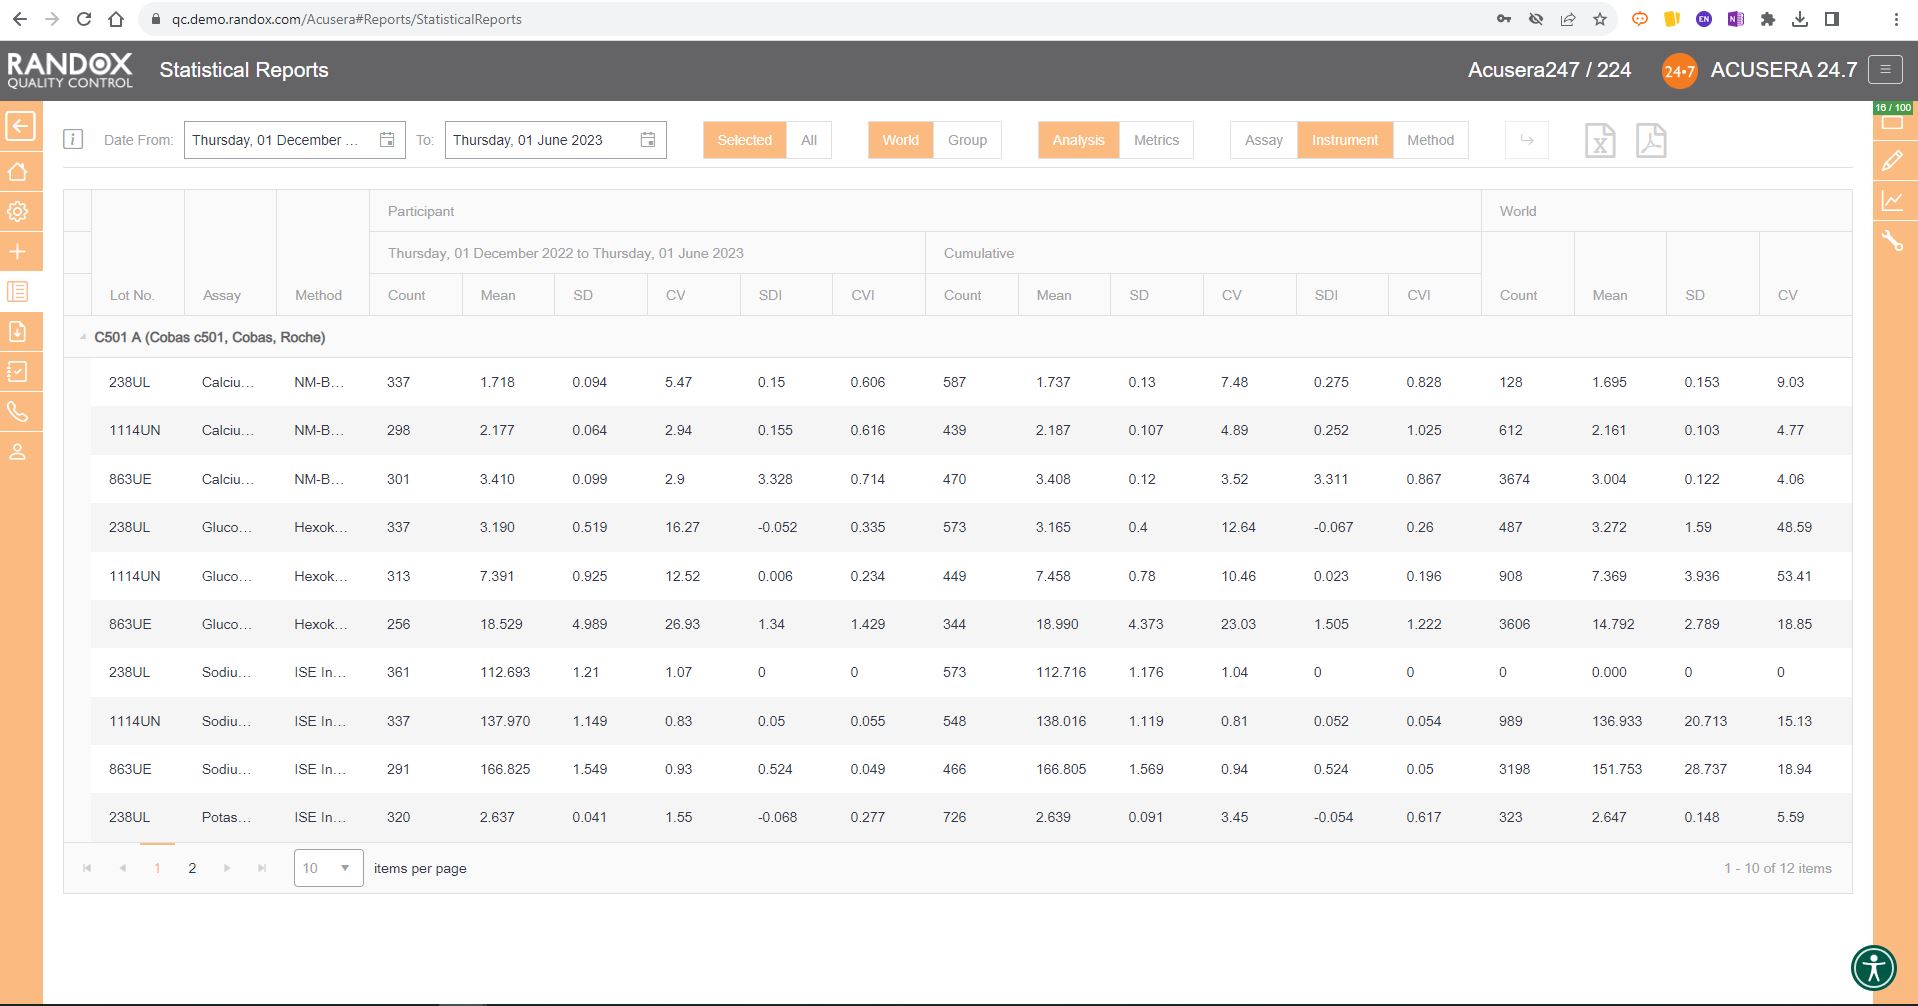
The first report we will look at is the statistical analysis report. This report allows you to view your IQC data from a specified date range, and compare it to your cumulative data, that is, all the IQC data you’ve collected since you began using that lot, as well as the peer group data for the same lot all within one screen. If you are part of a chain of laboratories, you can compare this data with your laboratory group to see how your lab stacks up by using the World/Group toggle button.
This report provides you with the count, mean, SD, CV, SDI and CVI for a lot and can be organised by assay, as shown in the image below, instrument, or method, allowing you full freedom to customise this report to suit your needs. Don’t forget, like all our reports and charts, this data is fully exportable to PDF or Excel for filing or data review.
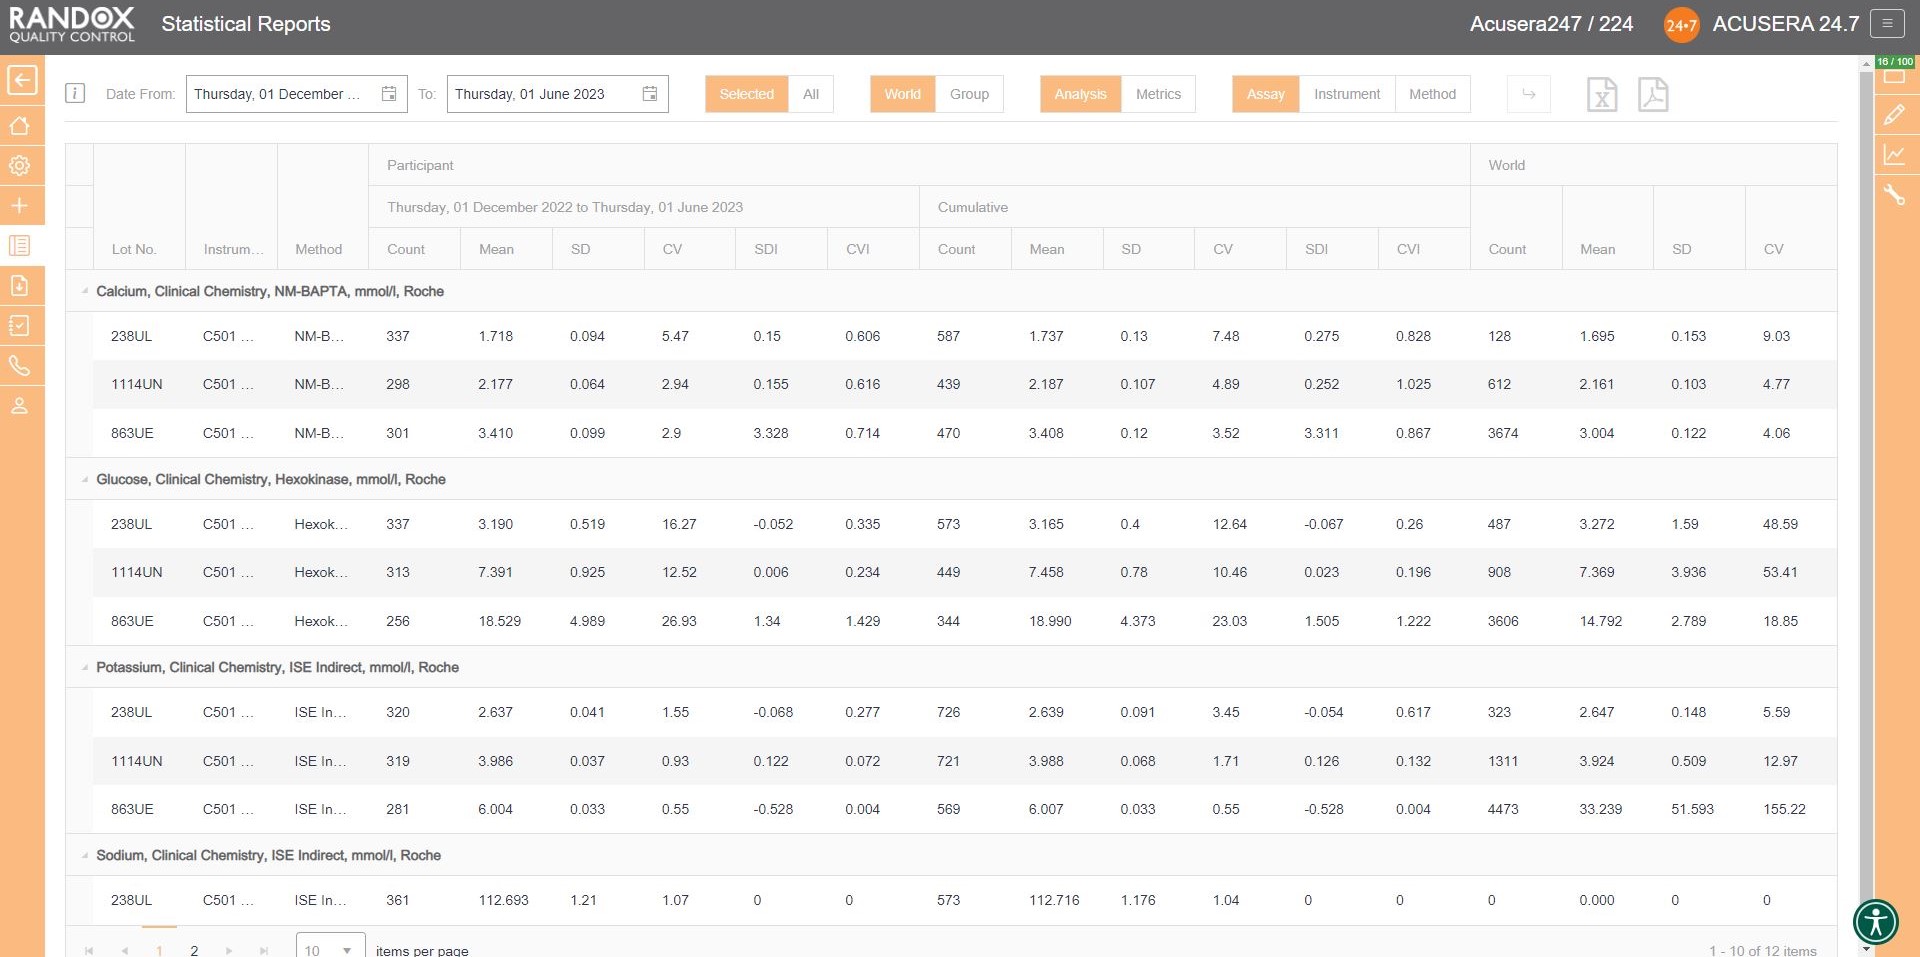
Handy, right? This report provides you with everything you need to carry out the validation and verification of new IQC lots, plus much more. We’ll look at this in more detail in an upcoming article.
Exception Reports
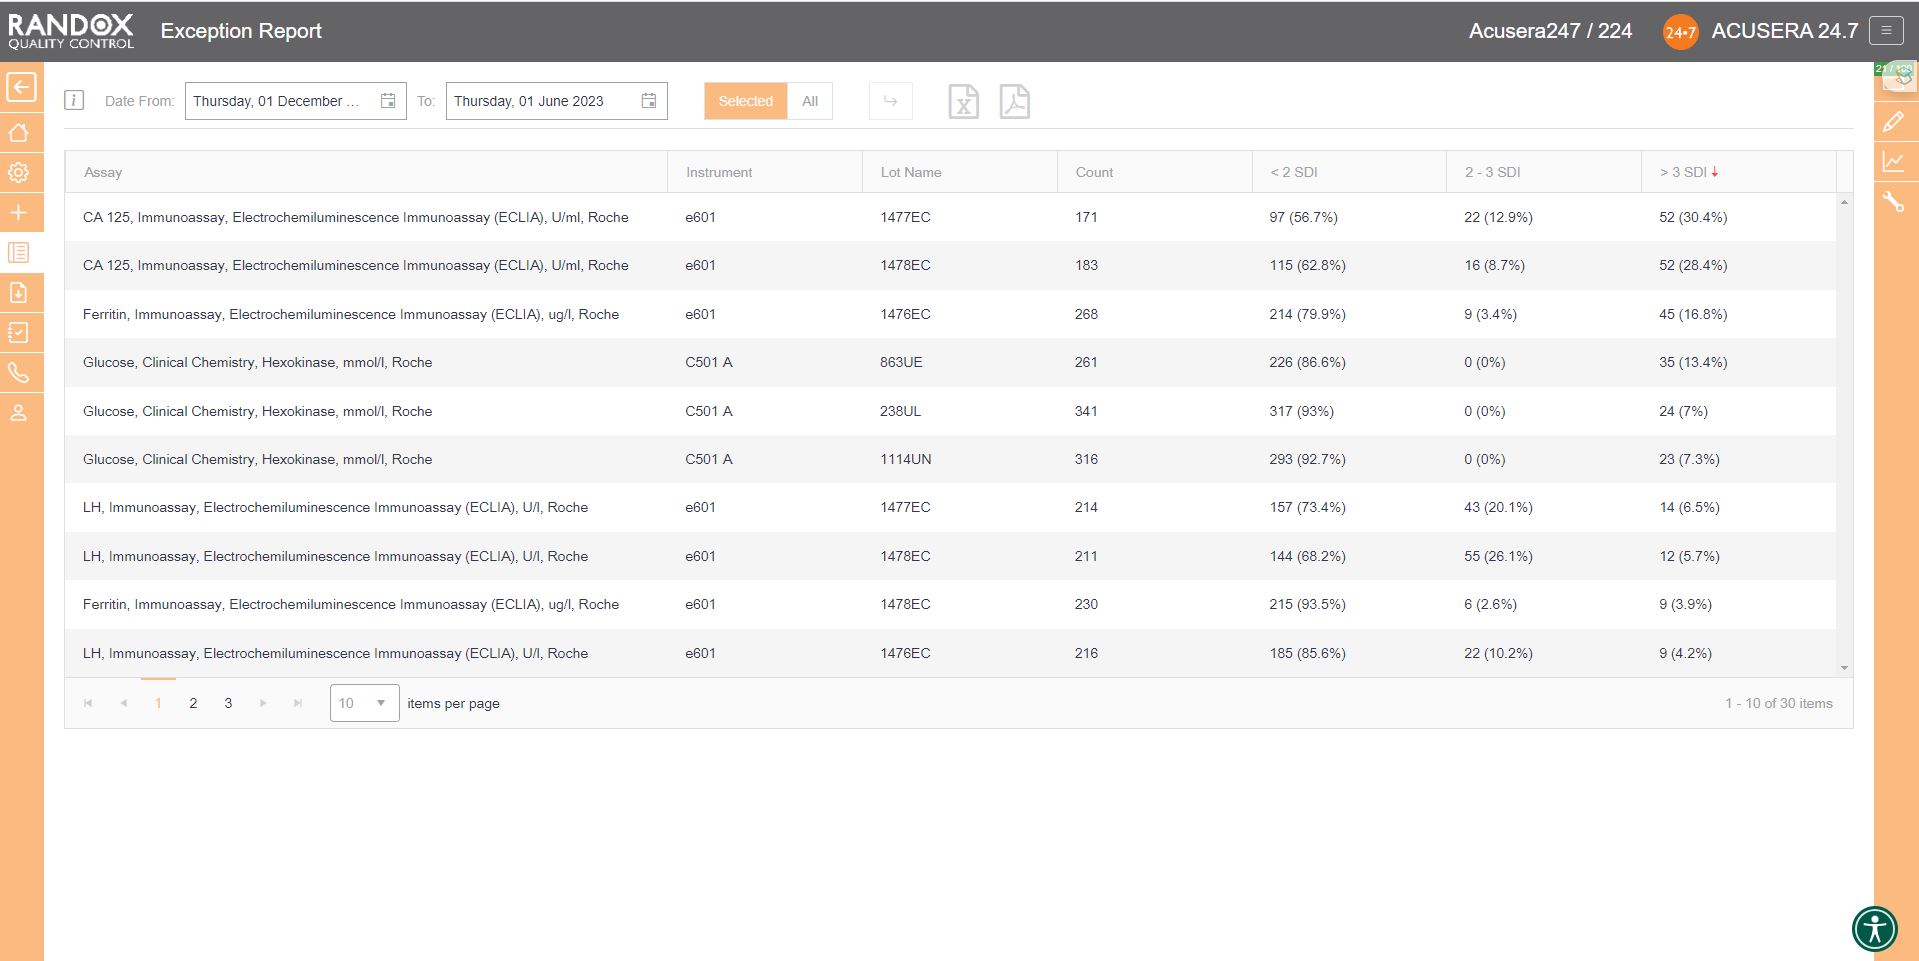
If you wish to determine your best and worst-performing tests, our exception report is perfect for you. This report is designed to quickly and easily identify assays with a high percentage of errors. The exception report provides an on-screen summary of the number of QC results for each individual assay and control lot that fall within the following categories: <2SD, 2-3SD and >3SD. This comprehensive performance review can be filtered: by clicking on the top of the ‘>3DSI’ column, this report will display assays in descending order with your worst-performing assays at the top, as shown below.
Filtering by ‘<2SDI’, it will display the same data with your best-performing assays at the top.
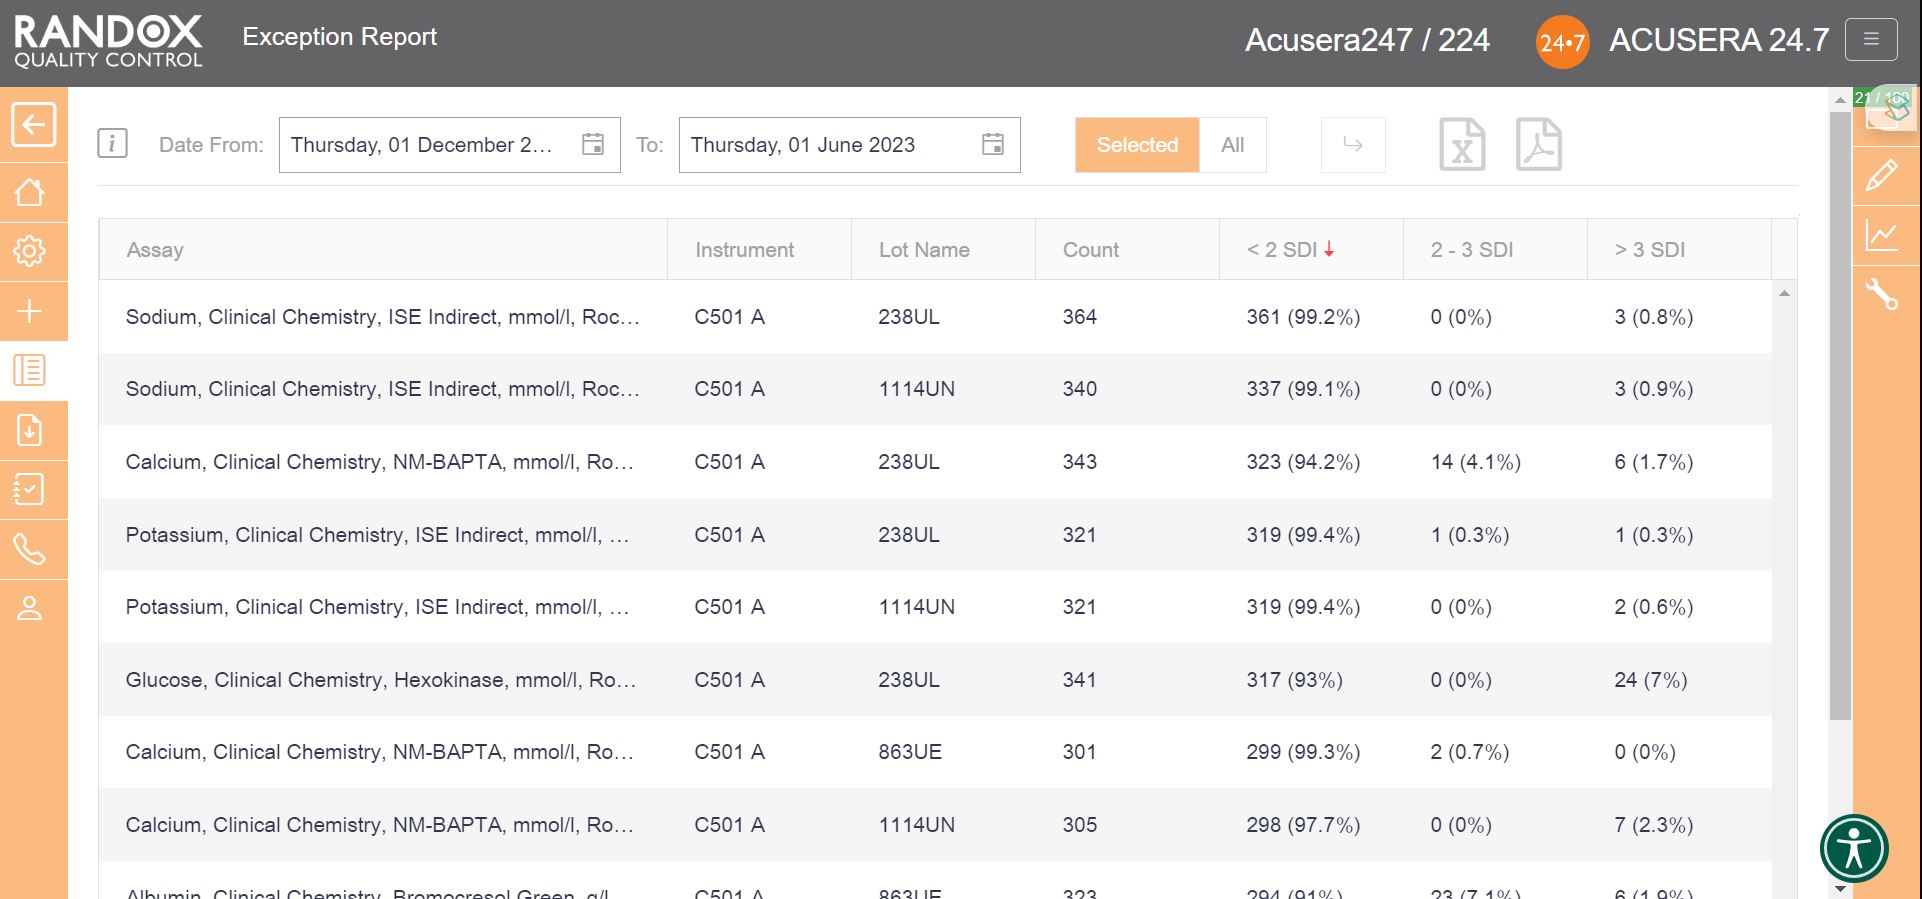
With this information, you can determine in which of your assay’s failures most often occur and encourage staff to look a little more closely at why failures arise and identify changes to improve and minimise errors.
Peer Group Statistics Reports
Now that you have figured out the performance of your assays, you’ll want to see how you compare with others running the same tests. Our Peer Group Statistics Report is your new best friend.
Updated live and in real-time, with no submission deadlines, you can compare your statistics to those of your peer group, determined by analyte, method, instrument manufacturer and model.
Simply select the IQC lot you wish to analyse and Acusera 24.7 will generate the data for you, displaying the count of QC data, mean, SD and CV, giving you comprehensive insight into your performance vs your peers.
You can customise this report even further. If you select an analyte, we’ll show you the data for that analyte alone. If not, we’ll show you the information for all analytes related to that lot. The same goes for specifying a date range – if you choose a range, we’ll show you the data inside that range alone. If not, we’ll show you all the data for your chosen lot.
By clicking on the headers, you can filter the data – 1 click will display the data in ascending order, 2 will show you a list in descending order and 3 clicks will reset the table.

When these reports are combined with the other impressive features of Acusera 24.7, like our fully customisable charts or advanced statistical analysis, this software can help streamline your IQC procedure and data review process.
When the accreditors come knocking, others will be scuffling around trying to gather multitudes of reports and files, but you will be sitting with a smile on your face and your feet up, because you’ve got Acusera 24.7.
With full onboarding assistance and technical support that’s top-of-the-class, you’ll always have someone to help you get to the bottom of any problems that you face.
If you haven’t already booked a demo, get in touch with us today and let us show you how much time we can save you with this innovative and intuitive software. Alternatively, take a look at our Resource Hub for some material on Acusera 24.7 or Acusera IQC.
To streamline your QC Data analysis, get in touch with us at marketing@randox.com.
Acute Kidney Injury and Antimicrobial Stewardship
An estimated 1 in 5 hospital admissions in the UK is associated with acute kidney injury1, providing a clear illustration of the need for novel, rapid detection methods. Our latest whitepaper looks at this common condition and the links between Acute Kidney Injury and Antimicrobial Stewardship. For more details on the things discussed in this article, you can download the full whitepaper below.
Acute Kidney Injury
Acute Kidney Injury is defined as a sudden loss of kidney function. This causes a disruption in the kidneys’ ability to filter waste out of your blood resulting in an accumulation of waste products as well as other imbalances.
The loss of kidney function is the result of a sudden reduction in glomerular filtration rate (GFR), the process through which waste is extracted from the blood and is often reversible2.
Aetiology of Acute Kidney Injury
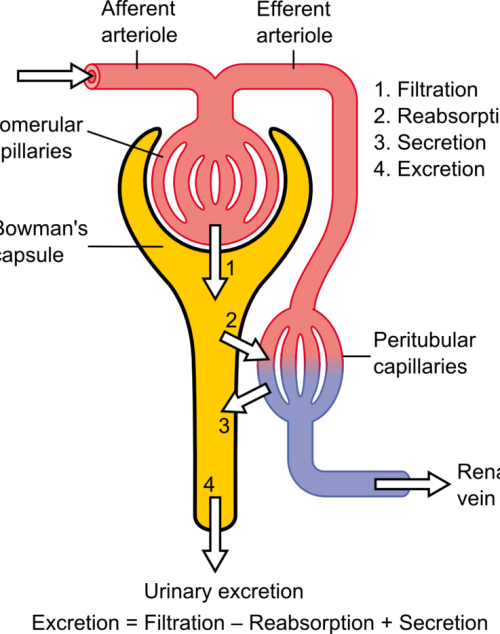
The differential pressure existing between the glomerulus and Bowman’s is the driving mechanism for glomerular filtration2. This pressure contrast is influenced by the combined resistances of the afferent (leading to the glomerulus) and efferent (leading away from the glomerulus) vascular pathways in the kidney. Under normal kidney function, these resistances are in equilibrium, facilitating the proper functioning of the GFR. For example, an increase in efferent resistance restricts the blood flow out of the kidney, elevating pressure inside the kidney and reducing GFR, and vice versa2. However, in AKI, the decline in renal blood flow and GFR has a pathological origin. The pathophysiology of AKI can be classified as prerenal, intrinsic renal, or postrenal.
Pre-renal Acute Kidney Injury
Pre-renal AKI is caused by reduced afferent blood flow or, in other words, increased afferent resistance. While tubular and glomerular functions generally remain intact, pre-renal AKI may be caused by systemic hypoperfusion (decreased blood flow) or selective hypoperfusion to the kidney, caused by renal artery stenosis or aortic dissection3.
Intrinsic Renal Acute Kidney Injury
Renal AKI describes the conditions which affect the glomerulus or tubule, for example, acute tubular necrosis and acute interstitial nephritis. This collection of conditions is associated with vasoconstrictor expression in renal afferent pathways2.
Post-renal Acute Kidney Injury
Post-renal AKI usually results from an obstruction in the filtration system. Causes of obstruction include kidney stones, tumours, or blood clots, commonly in the bladder outlet. Obstruction affecting one side might not invariably lead to acute kidney injury, especially when the impediment develops slowly, such as with tumour growth. This is because the unaffected kidney might be able to adjust and make up for the compromised functionality3
Symptoms & Treatment
AKI often manifests with decreased urine output as its primary symptom. However, additional symptoms, when present, can encompass fatigue, nausea, vomiting, or confusion4. To achieve an accurate diagnosis, a comprehensive review of the patient’s medical history and a physical examination are essential to identify the underlying cause of the condition.
The treatment and management of AKI are contingent upon the root cause of the condition. In milder cases, measures are implemented to maintain appropriate levels of fluid, electrolytes, and blood pressure. Nutritional support may also be administered when necessary. In the most severe instances of AKI, dialysis may be warranted to compensate for the diminished kidney function5.
Creatinine serves as a valuable diagnostic tool for evaluating renal conditions, including kidney health, GFR, and muscular dystrophy. However, abnormal serum creatinine (SCr) levels only become evident when a significant portion of the renal mass is compromised. The kidneys possess an impressive capacity to adapt to reduced function, which means that a considerable loss of function or GFR is necessary to influence SCr levels. This poses a challenge when it comes to early detection of AKI6.
Novel biomarkers, KIM-1, NGAL, Clusterin, and Cystatin C, are associated with AKI2 and can be analysed through molecular testing. These new methods can provide a fast and accurate assessment of an individual’s kidney health, at a much earlier stage than SCr quantification2.
Antimicrobial Stewardship
Antimicrobial Stewardship (AMS) programs are specifically crafted to enhance the efficiency of antimicrobial utilization, curtail the emergence of Antimicrobiasl Resistance (AMR), and enhance patient outcomes7. These programs encompass a variety of approaches, such as educational initiatives, training, the establishment of guidelines and protocols, ongoing monitoring and feedback regarding antimicrobial usage, and the management of antimicrobial formularies. Through the promotion of prudent antibiotic utilization, AMS programs contribute to the safeguarding of the efficacy of currently available antimicrobial agents and the deceleration of AMR development7.
Antibiotics and Acute Kidney Injury
Various antibiotics are associated with the progression of AKI due to their nephrotoxicity which can cause severe damage to the kidneys. These antibiotics include polymyxins, aminoglycosides and the commonly used, vancomycin8.

Randox Renal Injury Detection
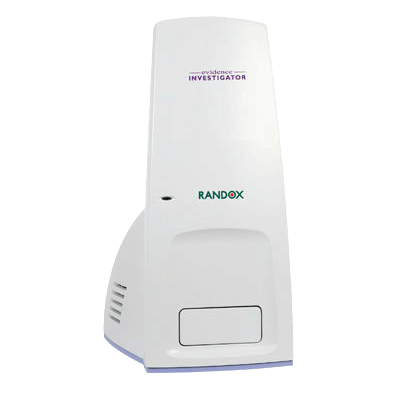
Using the patented Biochip Technology, the Randox Acute Kidney Injury (AKI) array, available on the Evidence Investigator, simultaneously tests for four novel biomarkers (KIM-1, NGAL, Clusterin, Cystatin C) delivering an early diagnosis and monitoring of treatment efficacy. Multiplex testing better captures reduced renal function, as each biomarker reflects different mechanisms that result in similar injury outputs, allowing for a more accurate picture of the underlying cause of AKI. Along with being able to identify AKI at a much earlier stage, this array provides an accurate and sensitive solution for the diagnosis and monitoring of AKI.
If you’d like some more information on the Randox Acute Kidney Injury Array or would like to add this technology to your laboratory, take a look at our website at https://www.randox.com/acute-kidney-injury/ or get in touch today at marketing@randox.com.
References
- NICE. How common is it? Acute Kidney Injury . Published July 2023. Accessed October 2, 2023. https://cks.nice.org.uk/topics/acute-kidney-injury/background-information/prevalence/
- Adiyanti SS, Loho T. Acute Kidney Injury (AKI) Biomarker.; 2012.
- Manzoor H, Bhatt H. Prerenal Kidney Failure.; 2023.
- NHS. Acute Kidney Injury. NHS. Published 2023. Accessed July 31, 2023. https://www.nhs.uk/conditions/acute-kidney-injury/
- Goyal A, Daneshpajouhnejad P, Hashmi M, Bashir K. Acute Kidney Injury . In: StatPearls [Internet]. StatPearls Publishing ; 2023.
- Rule AD, Lieske JC. The estimated glomerular filtration rate as a test for chronic kidney disease: Problems and solutions. Cleve Clin J Med. 2011;78(3):186-188. doi:10.3949/ccjm.78a.11004
- Baur D, Gladstone BP, Burkert F, et al. Effect of antibiotic stewardship on the incidence of infection and colonisation with antibiotic-resistant bacteria and Clostridium difficile infection: a systematic review and meta-analysis. Lancet Infect Dis. 2017;17(9):990-1001. doi:10.1016/S1473-3099(17)30325-0
- Clifford KM, Selby AR, Reveles KR, et al. The Risk and Clinical Implications of Antibiotic-Associated Acute Kidney Injury: A Review of the Clinical Data for Agents with Signals from the Food and Drug Administration’s Adverse Event Reporting System (FAERS) Database. Antibiotics. 2022;11(10):1367. doi:10.3390/antibiotics11101367
Charting the Course to Laboratory Excellence
Are you still using spreadsheets for your QC data and Charts?
You’ve been left behind.
But don’t worry!
Your laboratory’s ultimate ally in the quest for precision and excellence has arrived.
Acusera 24.7 is a tool that not only streamlines your QC data but also empowers you with a treasure trove of invaluable charts.
These charts are more than just numbers and lines; they are your secret weapon for troubleshooting, achieving accreditation, and driving continuous process improvement.
Acusera 24.7 doesn’t just offer charts. It offers a symphony of insights at your fingertips. From the precision of interactive Levey-Jennings charts to the competitive edge of performance summary charts for peer group comparison, from the rhythm of weekly mean charts to the clarity of reliable SD histograms – these charts are your compass in the world of quality control.
The best part?
You’re in control.
Tailor these charts to your unique needs, whether you’re dealing with single or multiple analytes, an abundance of QC lots, fixed or variable SDs, or need to pinpoint data within a specific date range.
Join us on a journey through the world of Acusera 24.7’s charts, where data becomes your strategic advantage, and discover why more laboratories are choosing Acusera 24.7 for QC data management every day.
Levey-Jennings Charts
Every laboratorian has seen countless Levey-Jennings charts and for good reason.
These charts are the unsung heroes of quality control in the laboratory.
They offer a visual snapshot of data over time, helping to detect trends, outliers, and systematic errors that might otherwise go unnoticed. Levey-Jennings charts are like the heartbeat monitor of your laboratory, providing real-time insights into the health of your analytical processes.
We’ve taken Levey-Jennings charts to the next level.
Our colourful graphs might look like they belong in a modern art museum, but trust me, they’re more than just eye candy.
Acusera 24.7’s Levey-Jennings charts are like the laboratory’s personal detective, sniffing out anomalies and shifts and making sure your QC data behaves.
Let’s have a look at what you can do with the Acusera 24.7 interactive Levey-Jennings charts.
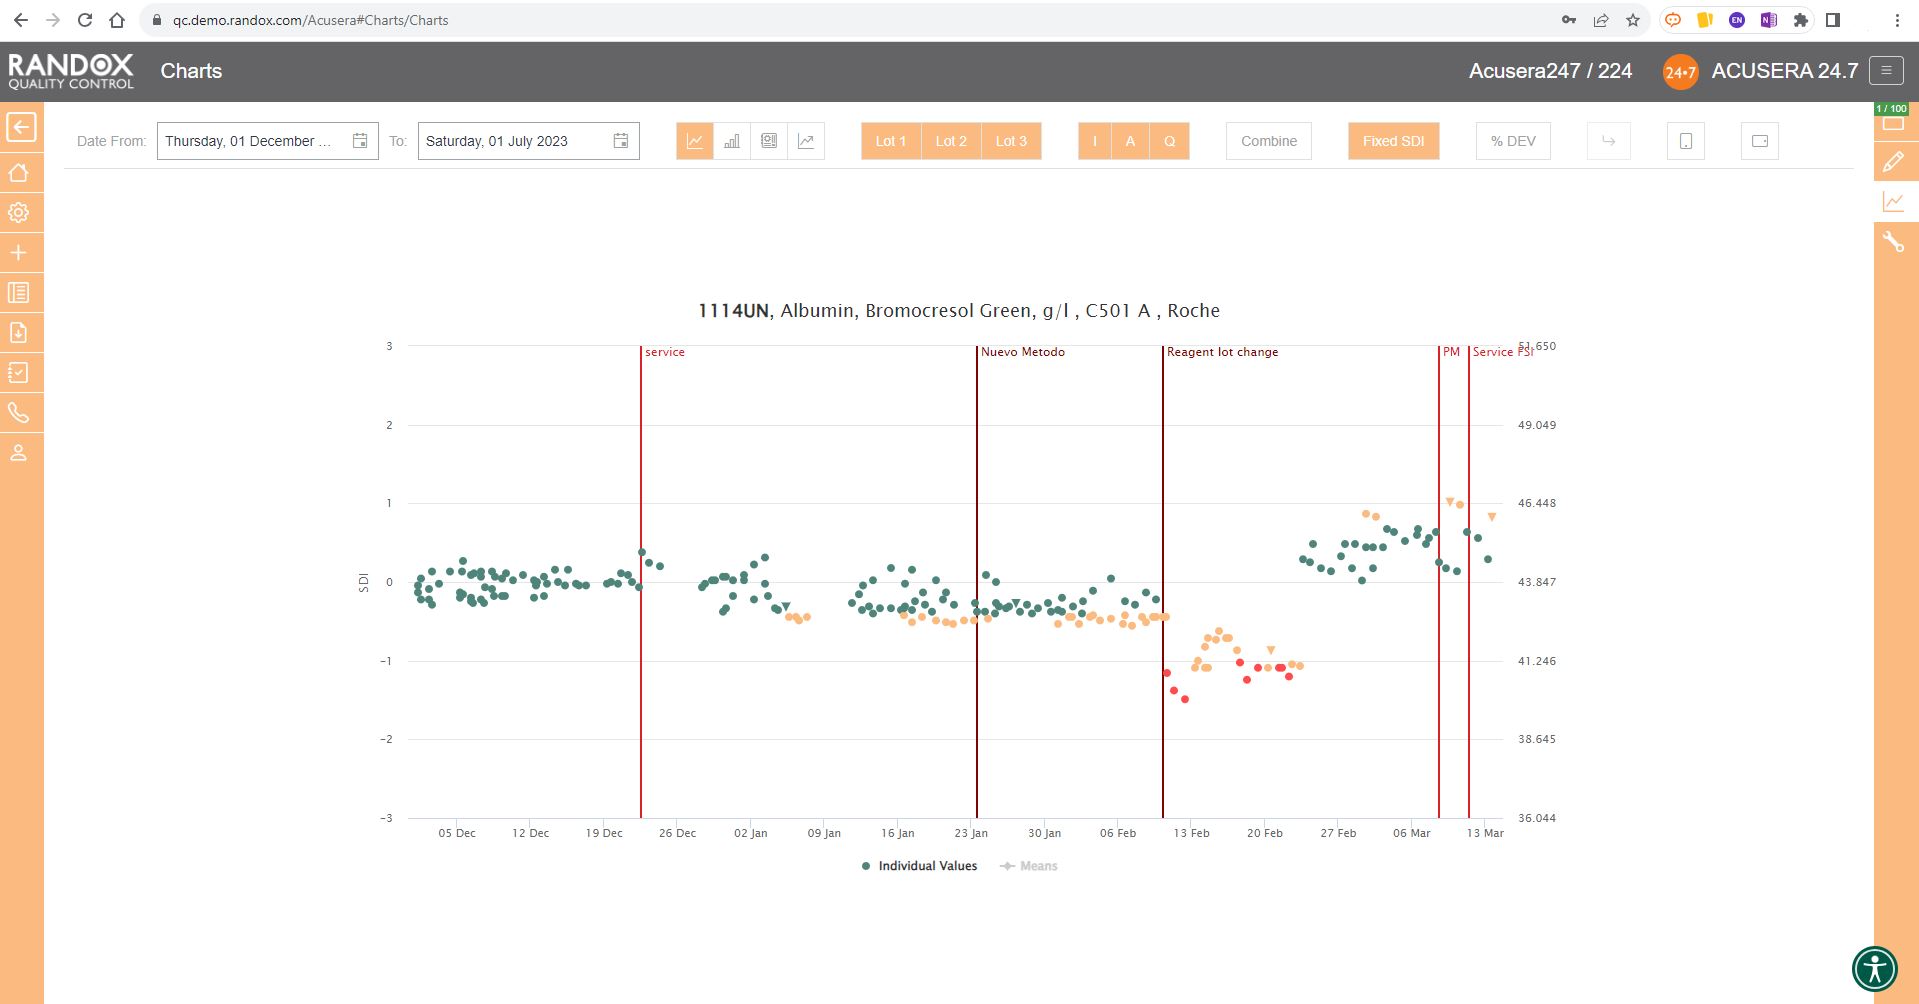
The screenshot below shows a Levey-Jennings chart for a single analyte, with the date on the X-axis and SD on the Y-axis. On this chart, you can see data points displayed in different colours. Green data points indicate an acceptable result. Orange points show data that has triggered your predefined alert criteria, while red points are those that have broken your set rejection rules.
The lines marked on the chart below represent events that have been recorded. Instrument events such as calibration events or maintenance can be recorded to monitor their effects on your QC, allowing you to quickly see how these events relate to any deviations or improvements in your QC data. For example, after the event labelled ‘Reagent lot change’ you can see a series of alerts and failures. Marking this event on the chart allows for an at-a-glance explanation of this deviation. These events are completely customisable so you can record any relevant information you want!
Finally, data points that appear as a triangle indicate a comment has been added. What text is included in the comment is completely up to you!
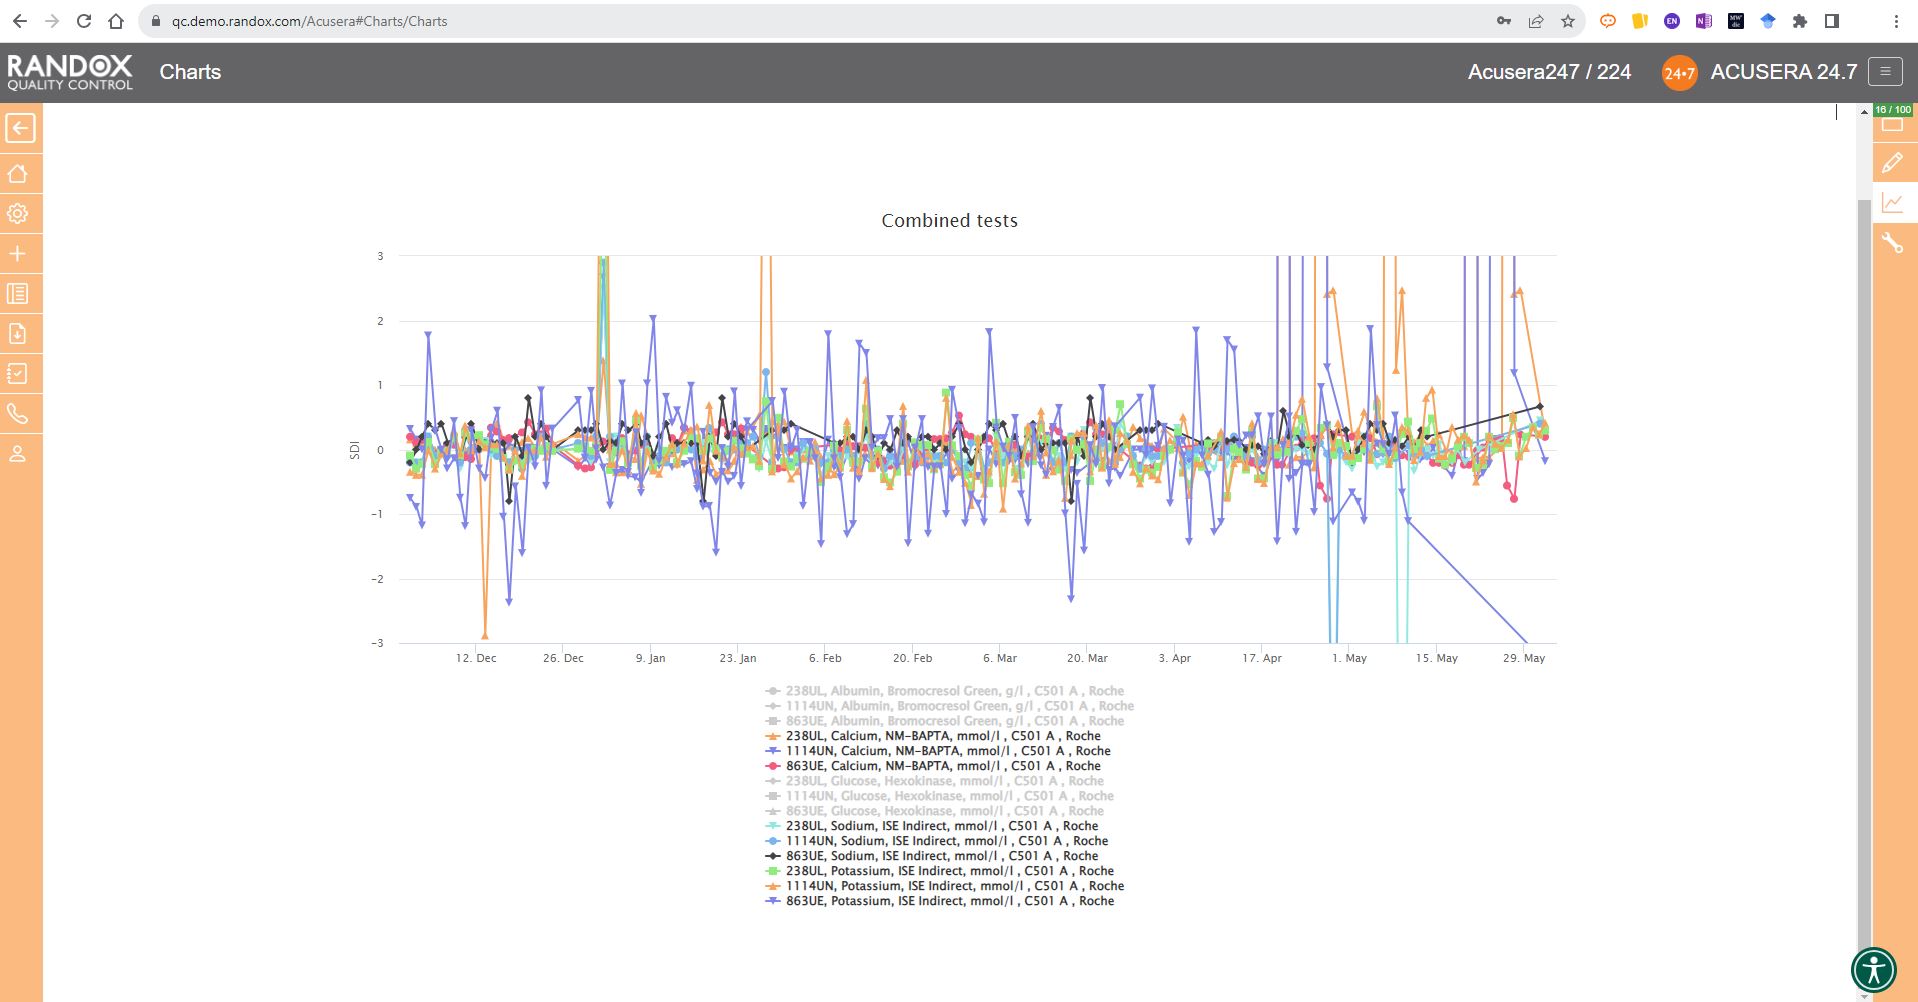
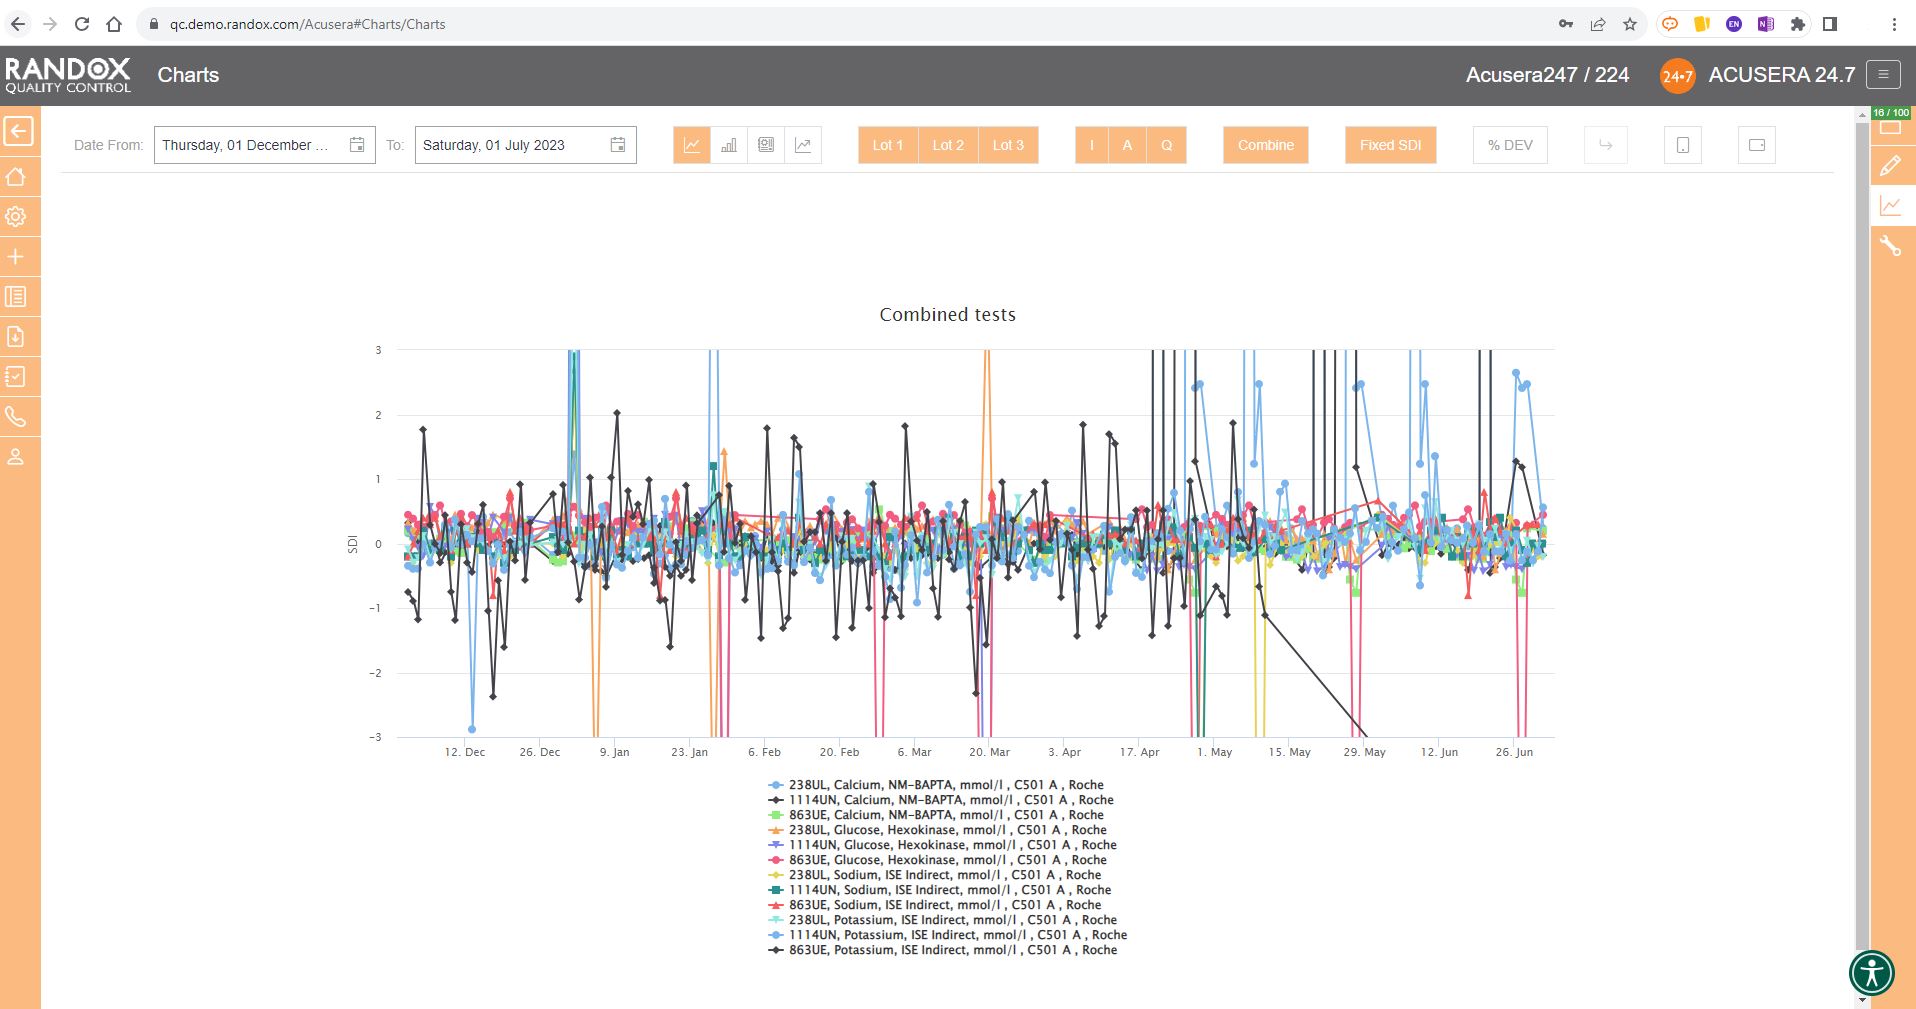
The next screenshot below shows a Levey-Jennings chart containing QC data for all the tests included in the Clinical Chemistry Panel.
Acusera 24.7 panels allow you to group related tests together, helping increase the efficiency of your data review.
It looks great, right?
Maybe a little confusing.
The screenshot is perhaps a little deceptive.
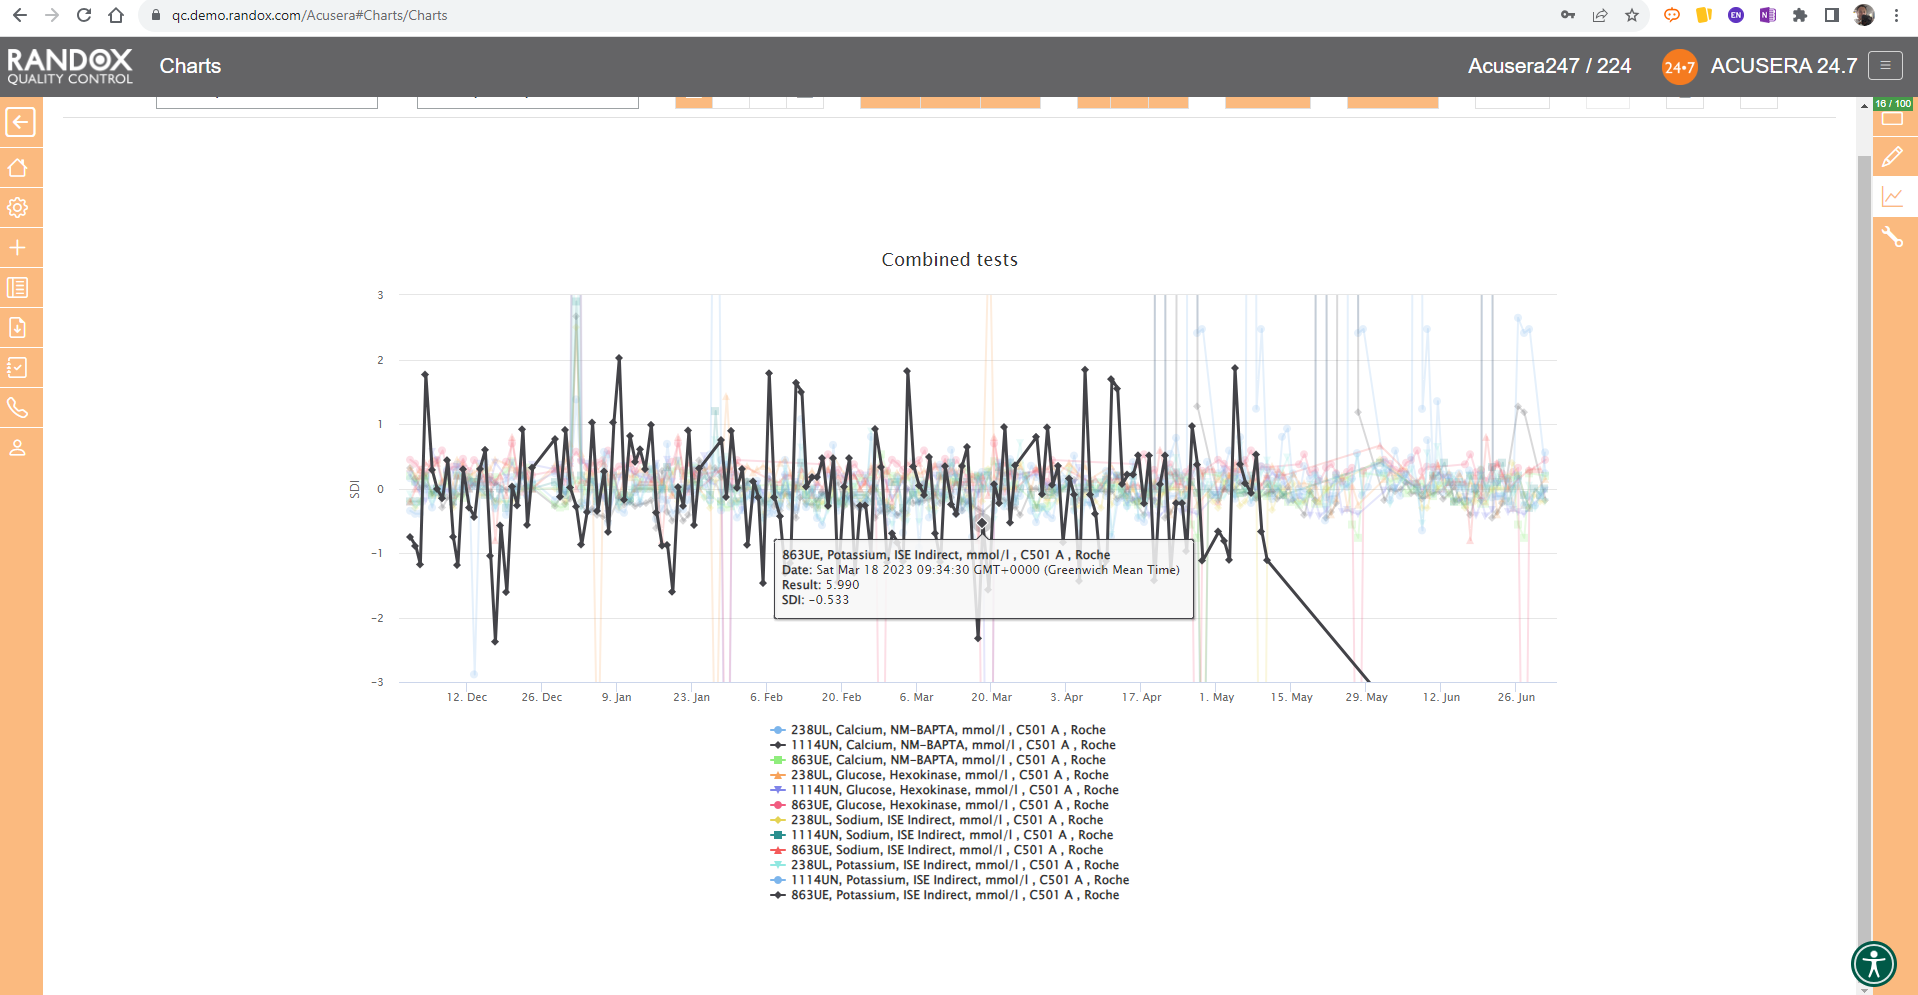
When viewing these charts live, you can view the data as a whole, or home in on individual data sets by simply hovering over the data you want to see. You can also selected a deselect datasets at will by clicking on its name in the list below the chart.
The screenshot below shows an example of this.
All the charts we’ve looked at so far have had a fixed 3SD on the Y-axis.
For a more in-depth review of your data, you may wish to expand this axis.
With the click of a button, you can expand the Y-axis to include all your data points. See below for an example.

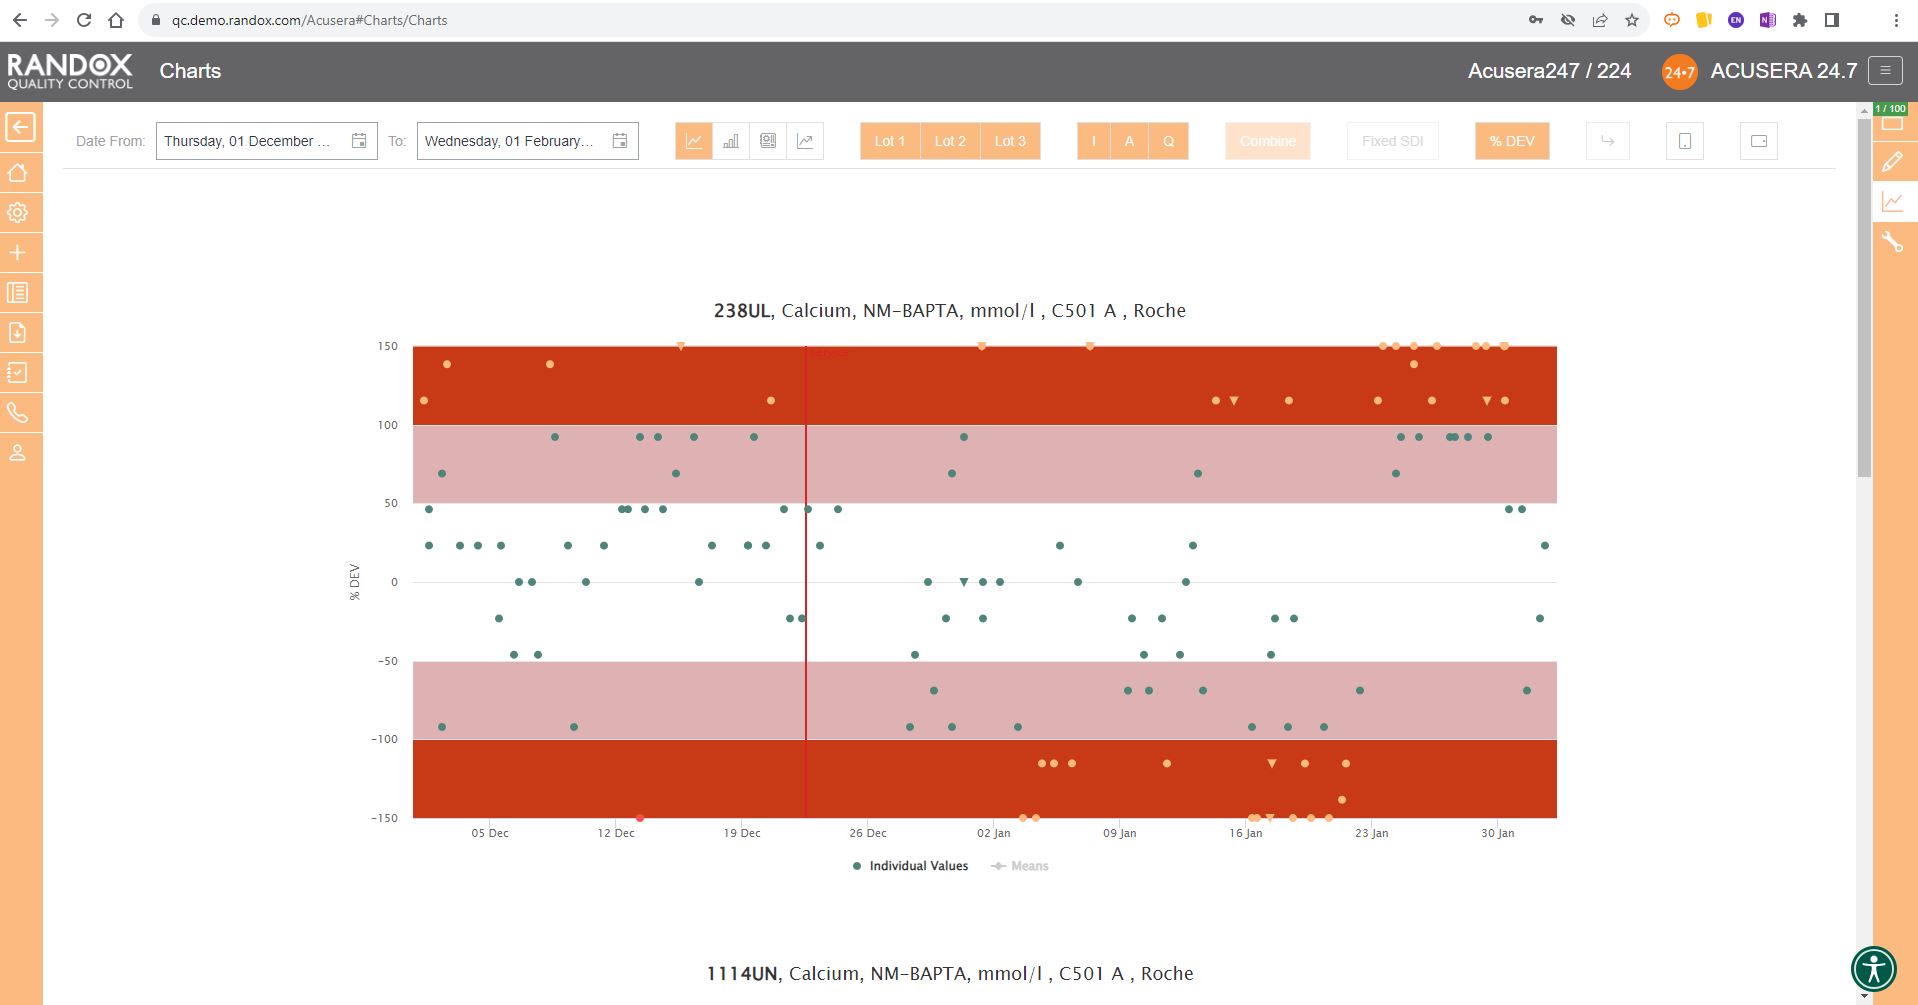
In some cases, you may wish to view this data displayed as ‘% Deviation’.
Again, with the click of a single button, you can convert the Y-axis to show just that, as shown below.
Performance Summary Charts
Peer group comparison of IQC data has a lot of benefits.
Comparing your data with other laboratories that use the same QC lot, instrument, method and more, can help you with troubleshooting and continuous process improvement.
The Acusera 24.7 Performance Summary Charts do all the work for you.
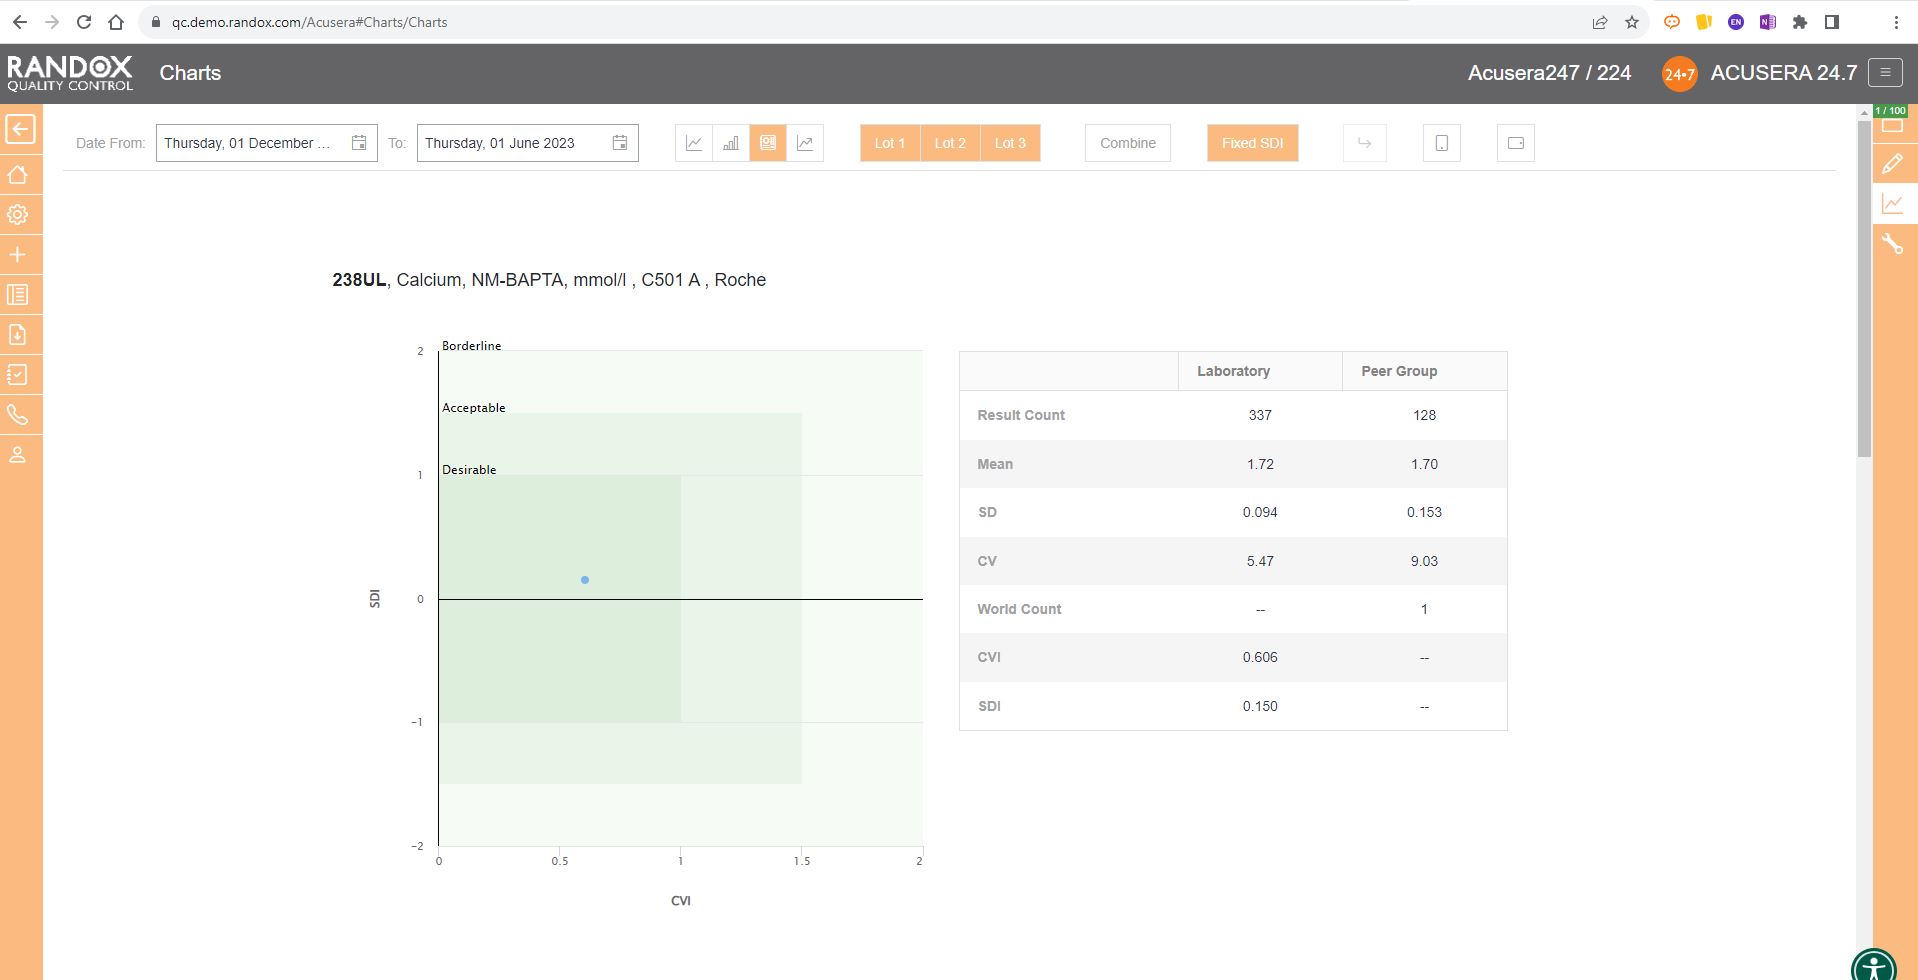
As shown in the screenshot below, these charts display your data and how it compares to your peers including mean, CV, and SD.
You can also view this data in a table to get a more detailed picture of your performance.
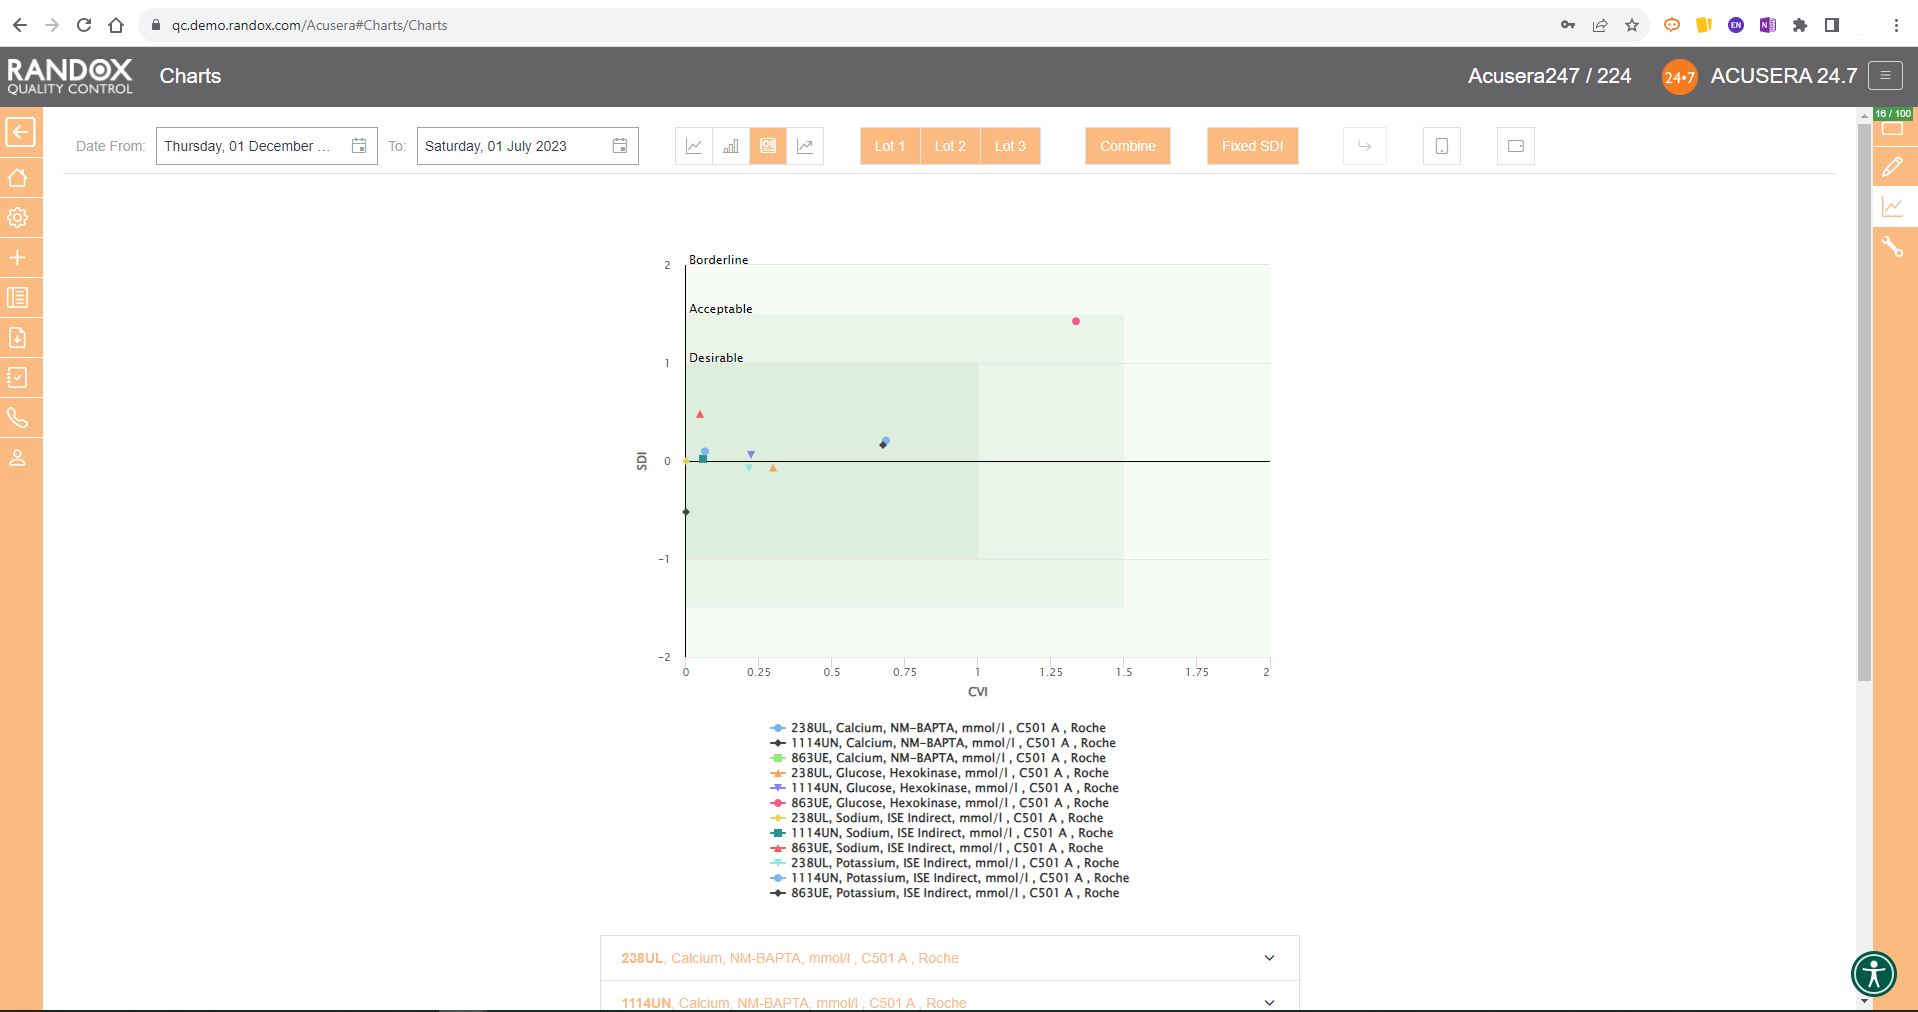
Like the Levey-Jennings charts, you can also combine this information for panels or a selection of multiple lots and analytes. You can see an example below:
Weekly Mean Charts
Weekly Mean Charts are one of the new features in our latest software release.
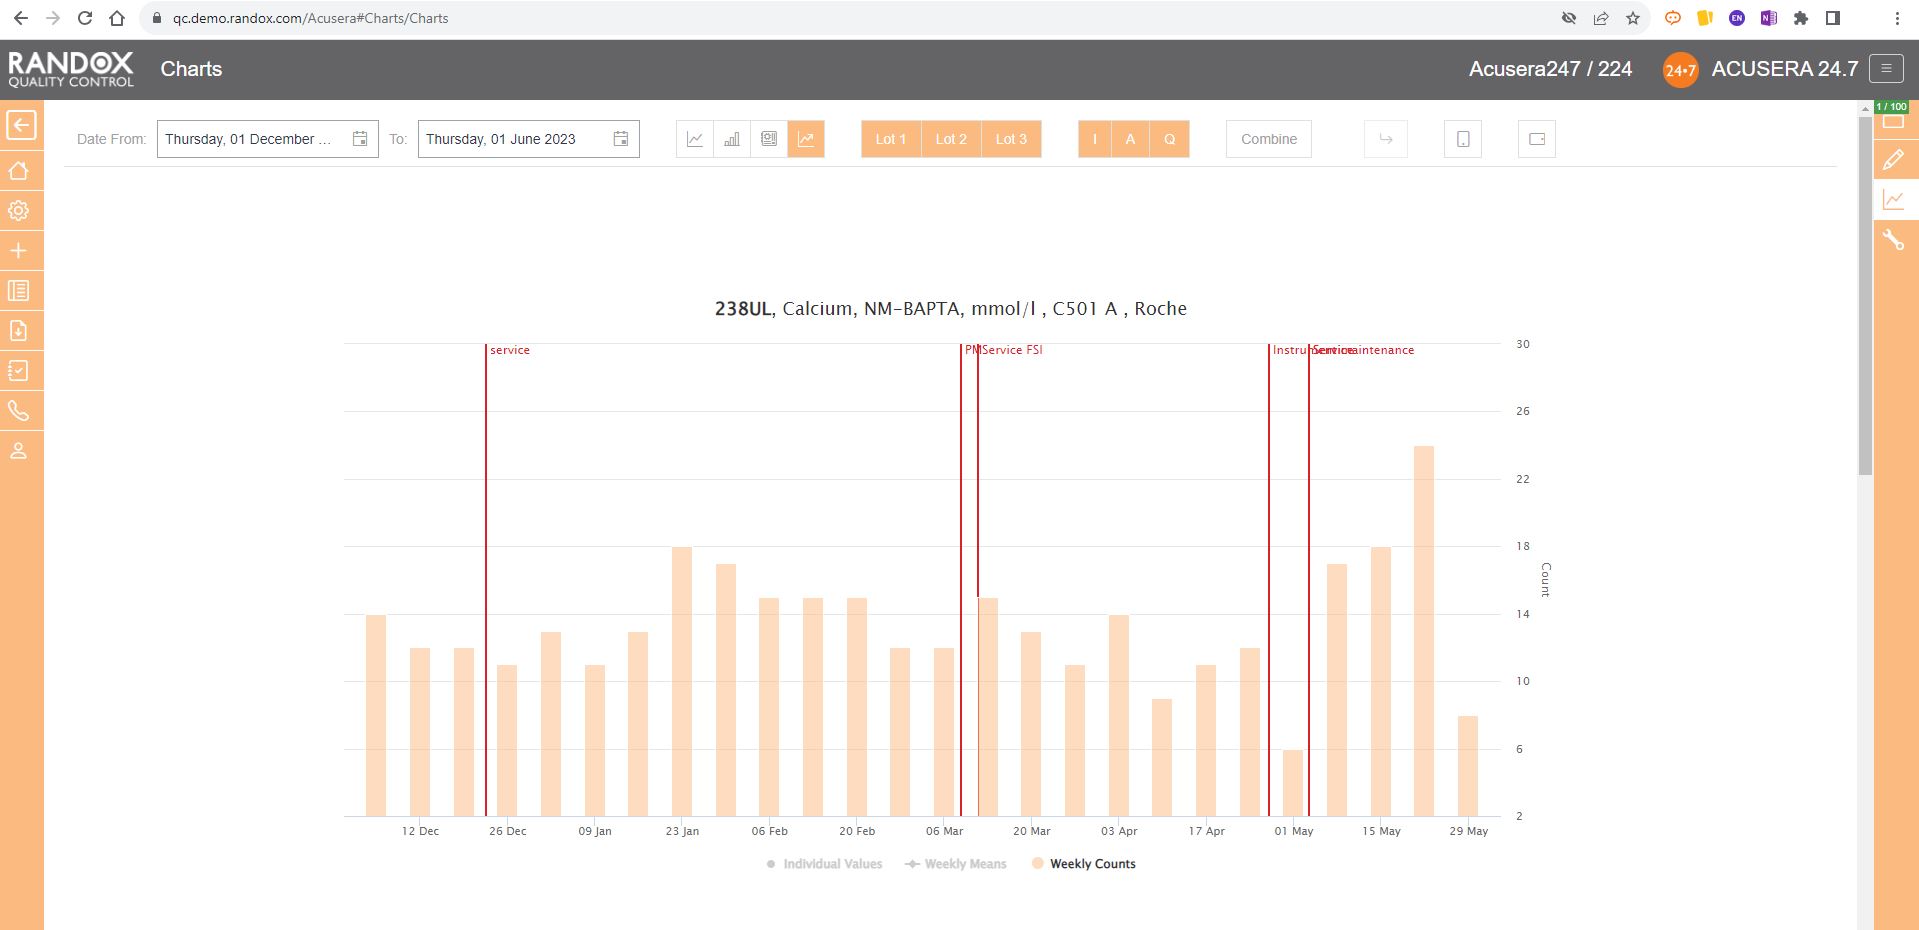
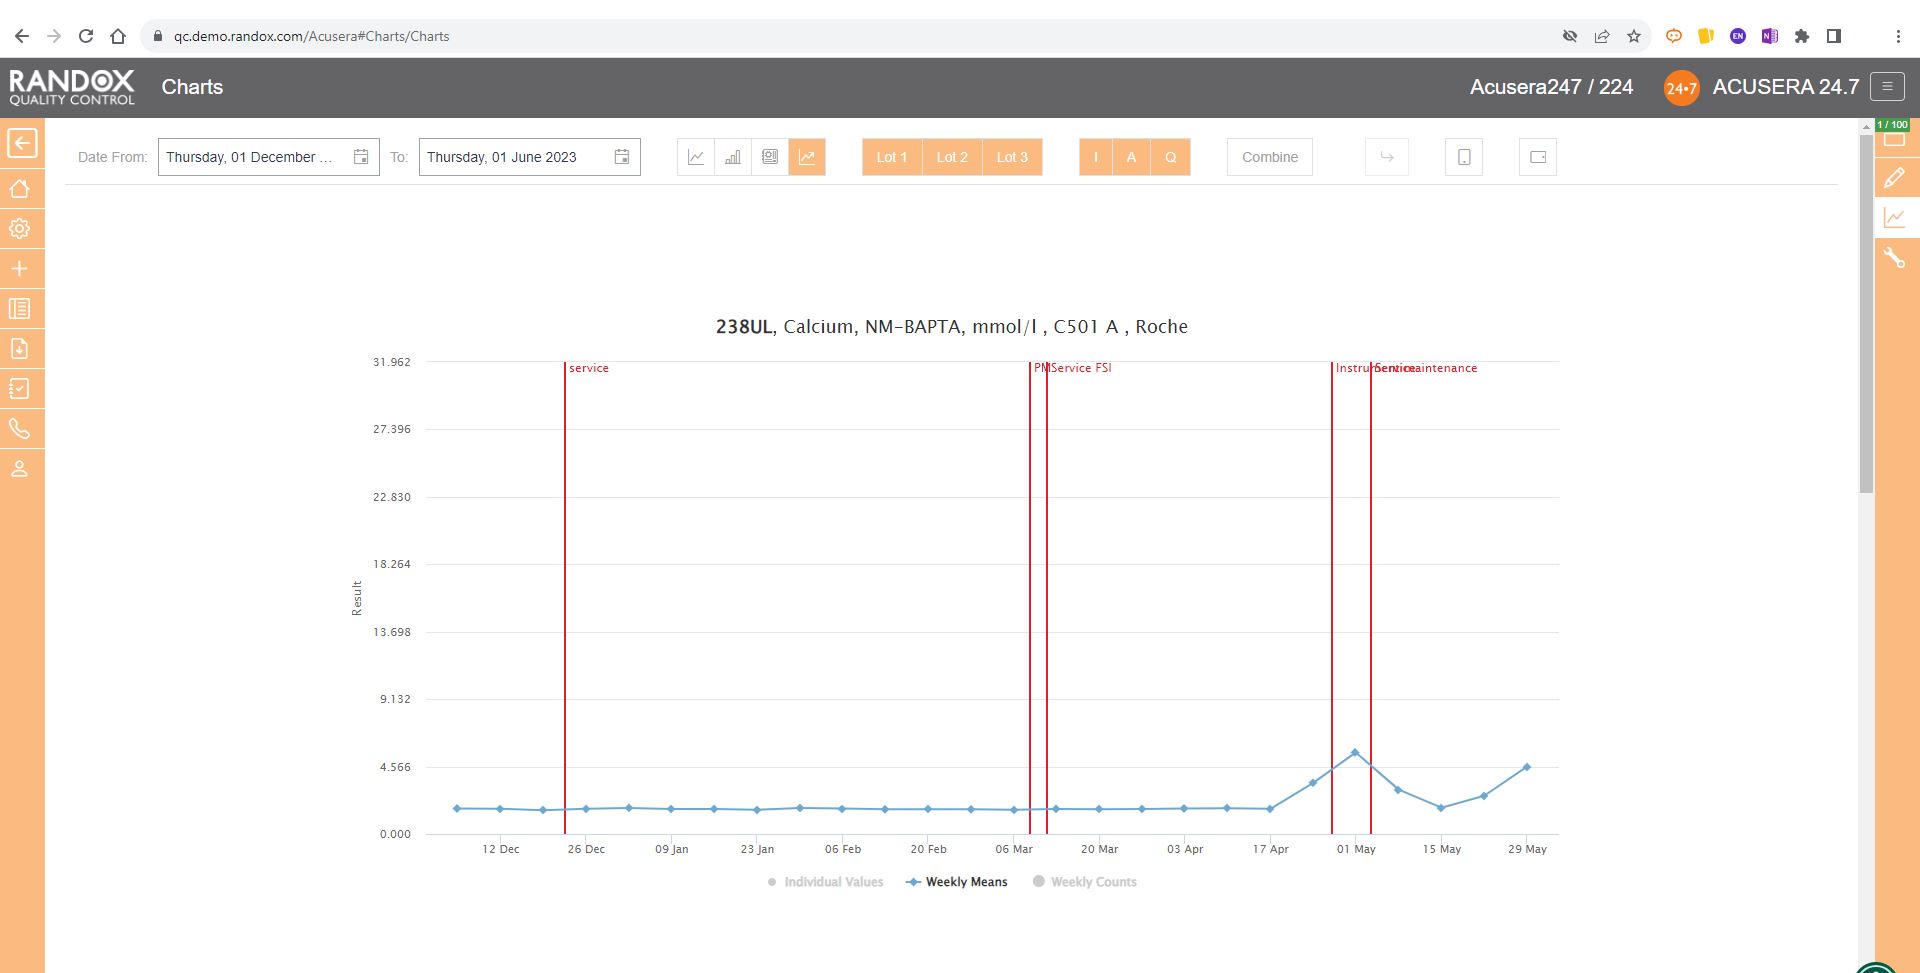
They allow you to view your weekly count of QC results for a specific instrument, assay, or lot.
Below is an example in a bar chart format.
You can also view this data as a line graph, which plots the weekly mean of results from multiple instruments using the same assay and QC lot, allowing a comprehensive overview of your QC data.
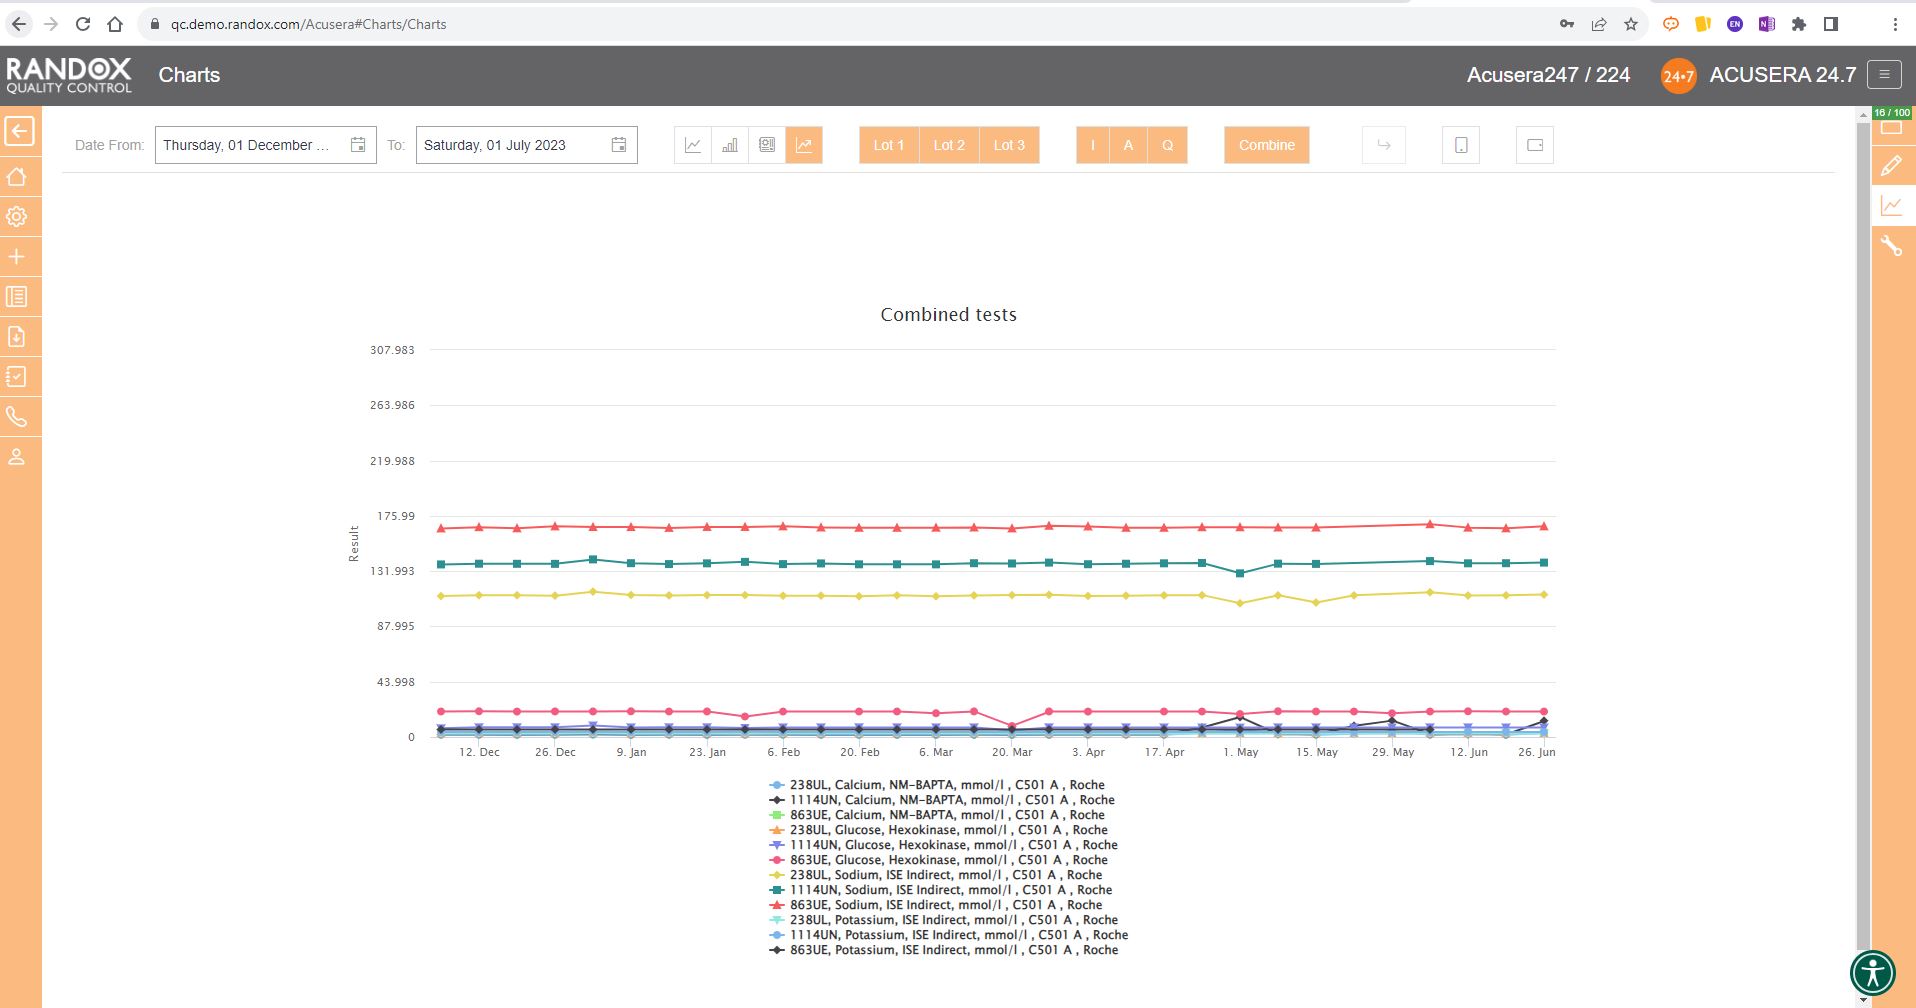
Or you can view your weekly means for a range of tests and panels.
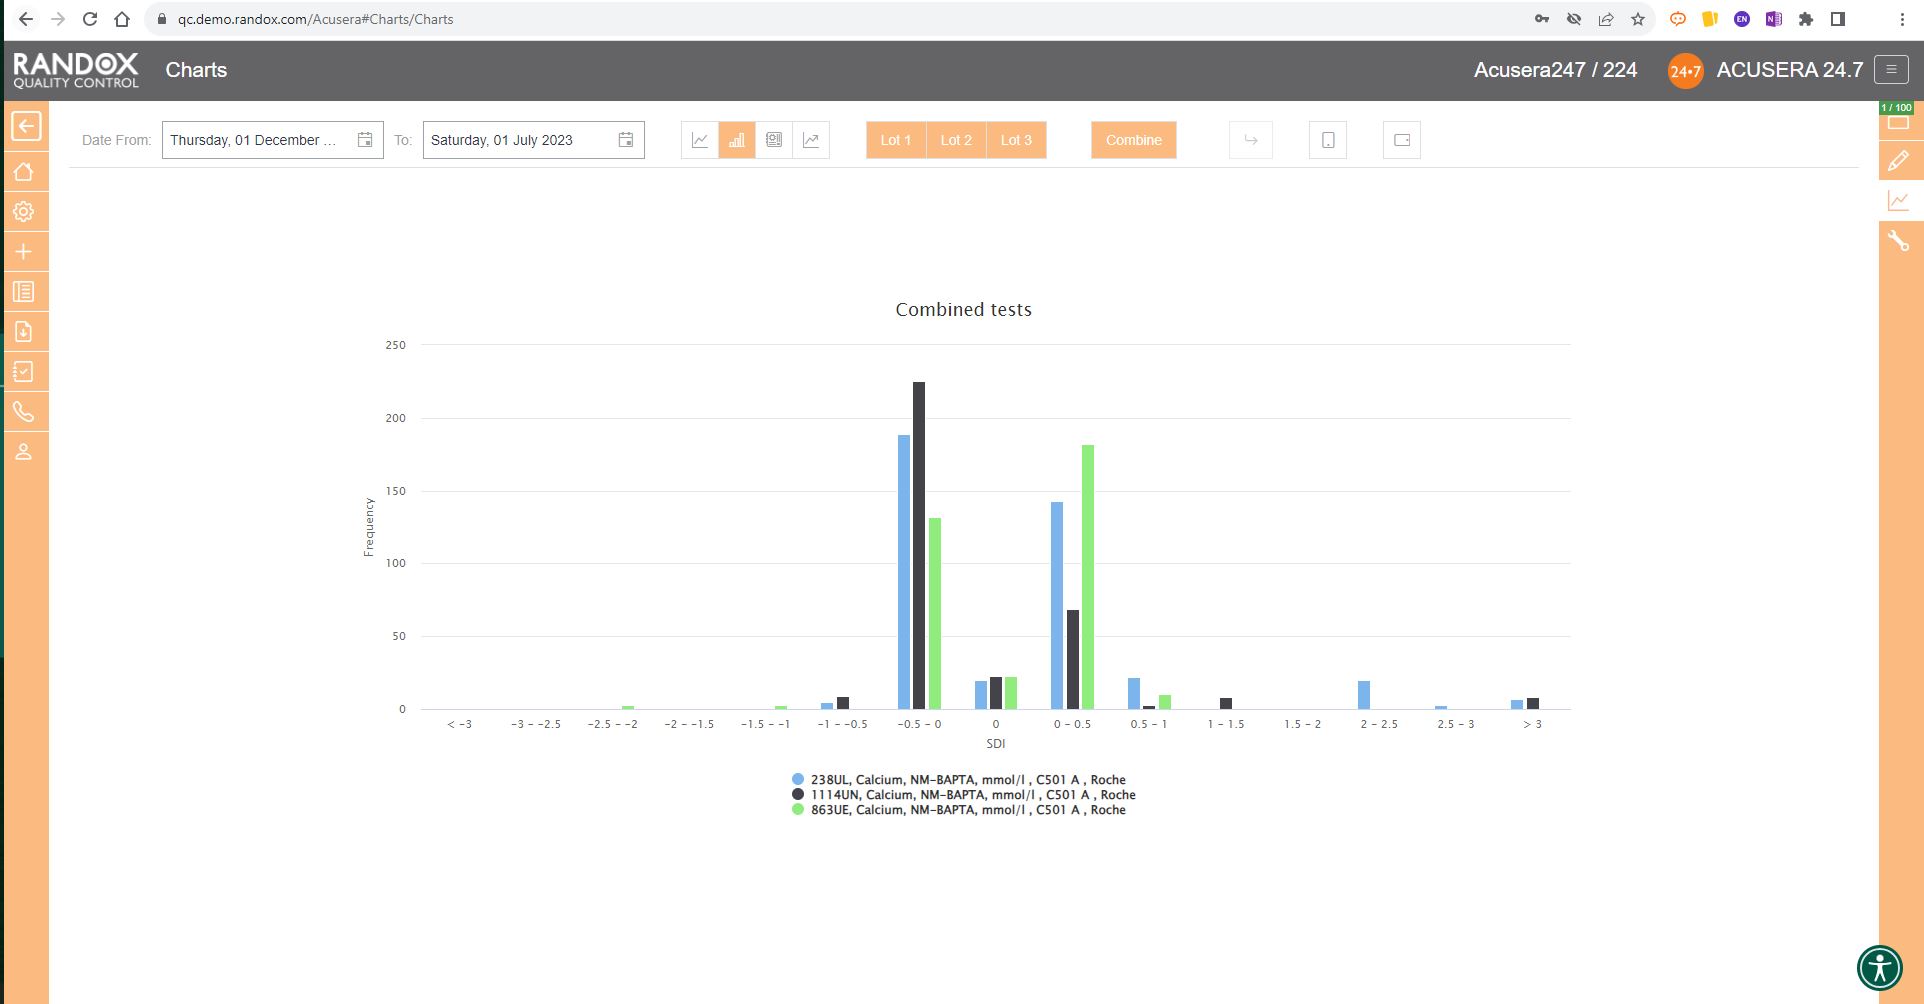
Finally, the SD Histograms allow you to view the distribution of your results, for an overview of performance.
When used with Acusera 24.7’s suite of advanced statistical tools and reports, our charts can help you reduce the time you spend investigating non-conformances.
When the dreaded accreditation assessment approaches, you can relax. While others are scrambling to find documentation, you can rest assured that all the QC data you need is easily accessible.
Assessors love to see Acusera 24.7 load when they enter a laboratory because they understand how much easier QC management is when using our software.
We provide complete onboarding assistance and full training on the software for new customers while delivering prompt and effective customer support for existing users. The Acusera 24.7 and QC operations teams are always eager to help new and existing Acusera 24.7 users with any issues they experience.
To learn more about the features of this ground-breaking software, visit our website here.
Alternatively, feel free to reach out to us at marketing@randox.com for more information or to arrange a demo!
From Fear to Freedom: A QC Data Management Revolution
What if we told you we had a solution to the multitude of monotonous hours spent analysing reams of IQC data and could provide you with an intuitive tool packed with comprehensive and customisable reports, interactive charts, and automated statistical analysis to help improve your QC data management?
Perhaps it sounds too good to be true?
This time, it isn’t.
Uncertainty of Measurement. 6Sigma. QC Multi-rules. These words can strike fear into the hearts of even the most experienced laboratory staff.
With Acusera 24.7, we’ve reached under the bed and forced the monster that is advanced statistical analysis out into the cold.
Acusera 24.7 is a live, cloud-based, interlaboratory QC data management and peer group comparison software.
A mouthful. I know.
But let’s break it down
A live, cloud-based software means you can access your QC data from anywhere, anytime.
Bid farewell to the labyrinth of folders you hunt through when troubleshooting or looking for a specific dataset.
Interlaboratory management describes the momentous task many QC managers face – monitoring the QC performance of multiple laboratories in different locations, ensuring they all maintain the high standards required for accreditation and accurate patient results.
Unlike some big-name subscription services, we encourage you to use our software at different locations to help you monitor all your laboratories and instruments to see how their results stack up against one another.
Acusera 24.7 provides multiple levels of access which are completely customisable. This allows you to grant or restrict access to different parts of the software depending on what is required by your staff. This also allows QC managers to view data from all their sites in one location without needing multiple email chains from each laboratory.
Peer group comparison? Isn’t that what EQA is for?
Well, you would be right.
Yes, EQA does provide a comparison with your peer group, but it doesn’t have exclusive rights.
There are many benefits to comparing your IQC data with your peer group. The real-time comparison data aids with troubleshooting, or you can show off how great you are to your friends and colleagues.
You can select your peer group for an instrument, method and more, providing you with a comprehensive picture of how your laboratory performance compares to your peers using the same lot of control.
There are no submission deadlines. One less thing for you to worry about.
Still think it sounds too good to be true?
Then let’s look at some of the software features and how they can be used to make your daily QC data management easier.
Charts
For many laboratories, review of their QC data is a momentous task involving an abundance of printouts with different data tables and graphs and hastily scribbled notes going back maybe months, if not years.
With Acusera 24.7’s interactive Levey-Jennings charts, you can see the QC data from a specified date range. This helps visualise trends and biases over any period to simplify the troubleshooting and lot validation processes, or, can be used as evidence during accreditation assessments. These charts can be generated for a single analyte or for multiple analytes and QC levels.
You can also add events to the graph to record factors that might impact the performance of your analyser such as preventive maintenance, calibrations or switching QC lots. So, when you come to review the QC data and see a shift in the results, you can see at a glance if there was an explanation for the change in QC results.
What’s more, the points plotted on the chart will appear in orange or red if they trigger your alert or reject protocols respectively. Those that appear as a triangle indicate a comment is attached. Comments can be added to any data point directly on the Levey-Jennings chart, allowing you to record any information relevant to the data, saving you time, not to mention the cost of all those sticky notes.

This complements the Panel feature of the software. Within Acusera 24.7 you can create a panel of tests, for example, a Liver Function Test panel, grouping all the tests together. You can then view all the QC data for this panel at the click of a few buttons. Shown below is the collective data for a clinical chemistry panel.
When you do need the paper copy, all the charts and reports found in Acusera 24.7 can be exported to Excel or PDF for independent analysis or printing, making it easy to bring your data to meetings or for hardcopy filing and audits.
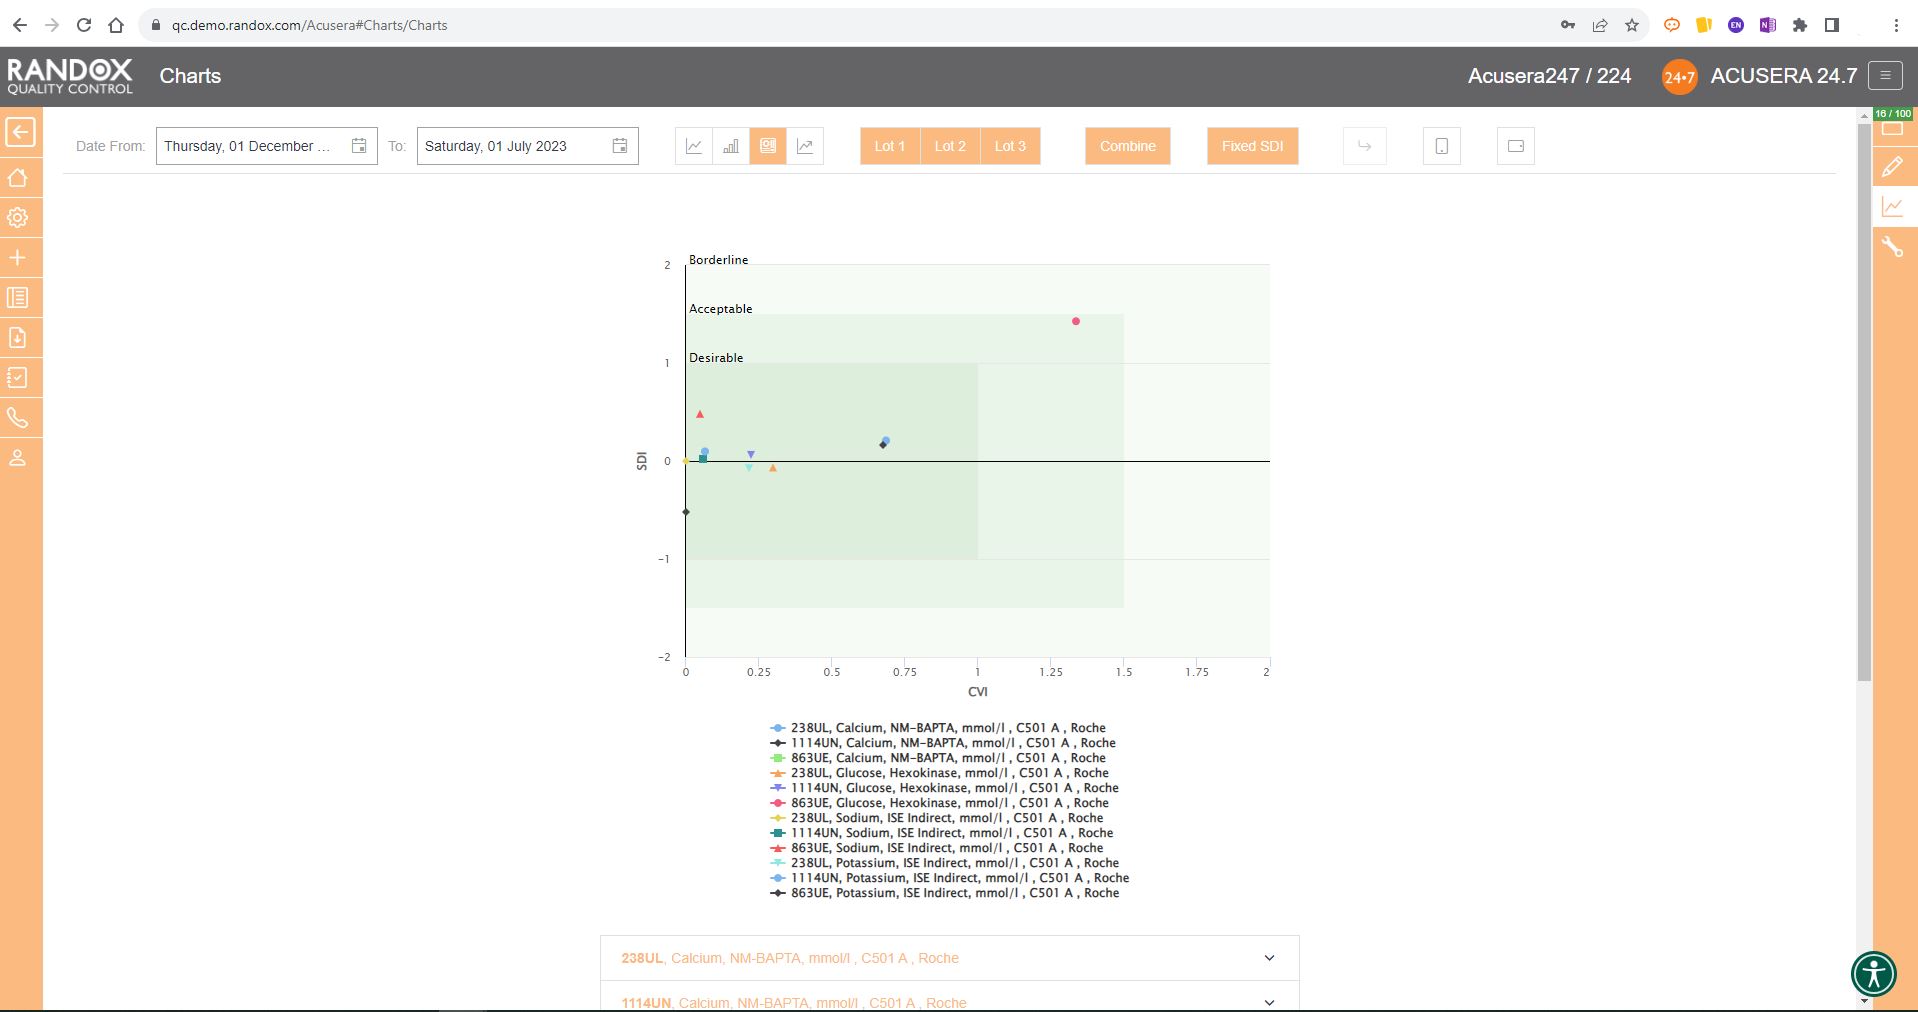
For peer group comparison, you can get a performance summary chart. This chart basically does the analysis for you! You define the date and time range, and the software looks at all the data points within it for you and your peer group, comparing individual data, means, CVs and SDs. Like our other charts, you can combine any number of these for multi-analyte analysis.
Advanced Statistics
Some people love statistics. Others can think of nothing worse.
Either way, there’s a lot of work involved in advanced statistical analysis.
Even if you’re in the love camp, you might find yourself sickened before you’ve finished this metaphorical jar of marmite.
The role of a pathology laboratory is not to run QC and show off their statistical skills, but to provide accurate and appropriate patient results.
As the old saying goes, time is money.
But in your case, time is the difference between a fast or delayed diagnosis for a patient.
This may impact their condition or treatment.
By making use of the suite of statistical options included in Acusera 24.7, including QC Multi-rules, 6Sigma and Uncertainty of Measurement, you can focus on providing the most accurate and efficient testing for patients.
Data Entry
To save even more time, Acusera 24.7 can be integrated with many LIMS or Middleware packages for fully automated data transfer. At a predefined time, your internal software will send your QC data to a shared folder on your network and from there to a Randox Cloud IP address, meaning we don’t go into your IT system and take anything; we won’t cause any information security problems. This data is then taken from the cloud and populated onto 24.7.
All this in less time than it takes you to say, ‘fully automated data transfer.’
You can also import your data through a semi-automated upload procedure. For this, the data is exported from your LIMS or middleware and imported manually to your Acusera 24.7 account using an EDI import file. Simply put, all you have to do is send the file, and the software will populate it onto the system. Alternatively, you can upload the data manually on the simple and intuitive data entry page.
Acusera 24.7, while comprehensive and initially daunting due to its vast array of features, is incredibly easy to use. The Acusera 24.7 and QC operations teams are always eager to help new and existing Acusera 24.7 users with any issues they experience. We provide complete onboarding assistance and full training on the software for new customers while delivering prompt and effective customer support for existing users.
We’ve only begun to cover the range of features available on Acusera 24.7 for QC data management! For more information or to arrange a demo, get in touch with our team at marketing@randox.com. Or, you can take a look at our website here.


