Effortless Data Management: Acusera 24.7 Reports
Effortless Data Management: Acusera 24.7 Reports
You’ve carried out your daily maintenance and run your IQC. You’ve got your results and now it’s time to type them up into one of your expansive spreadsheets. Reports
You’ve probably got your spreadsheet set up to calculate the required parameters already, but what if there’s an error in the formula? Or what if you make an error when entering your data? Or worse, what if you try to open the spreadsheet only to find that the file is corrupted or lost? If your Excel file is there, someone else might already be editing it, meaning you must wait until they’re finished before you can make any changes.
Even if you face none of these obstacles the labour-intensive statistics needed for performance review and validation might just keep you up at night.
Well, with Acusera 24.7, these concerns are history.
Whether you make use of our automated or semi-automated data entry options, you can be sure that the data put into the system is exactly that returned by your instrument. If you use the manual data entry option, we can’t remove the human error element – but with our simple and intuitive interface, we trust you’ll be flawless anyway. What’s more, the cloud-based nature of our software also means you won’t lose the data by mistake and unique access for each user allows multiple people to be logged in at the same time.

So, what next?
Well, you can view this data on our dashboard for fast and easy access to your results but delve a little deeper into Acusera 24.7 and you can access comprehensive, easy-to-read, customisable, reports designed to speed up the review process.
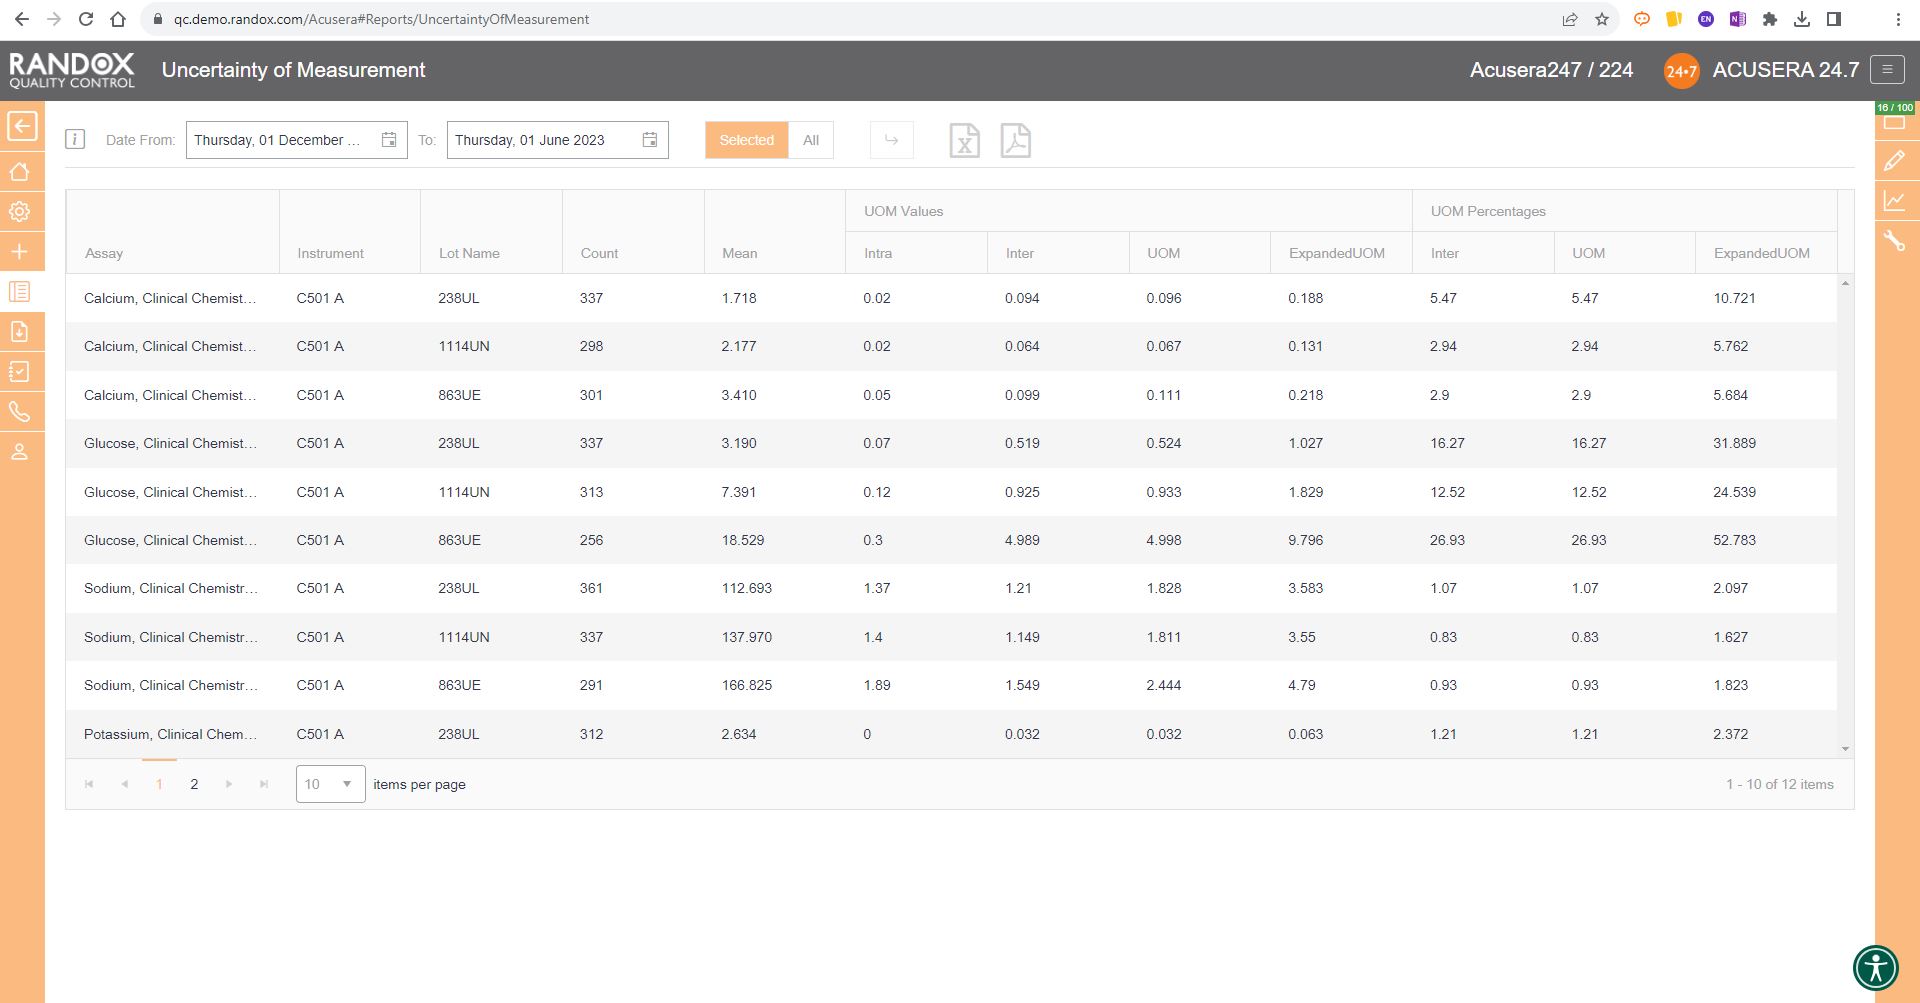
These reports include statistical analysis, exception reports, peer group statistics, uncertainty of measurement and advanced statistical metrics. The latter two we’ll look at in a dedicated article. For the others, however, let’s dive in and see how you could benefit from our range of extensive reports.
Statistical Analysis Reports
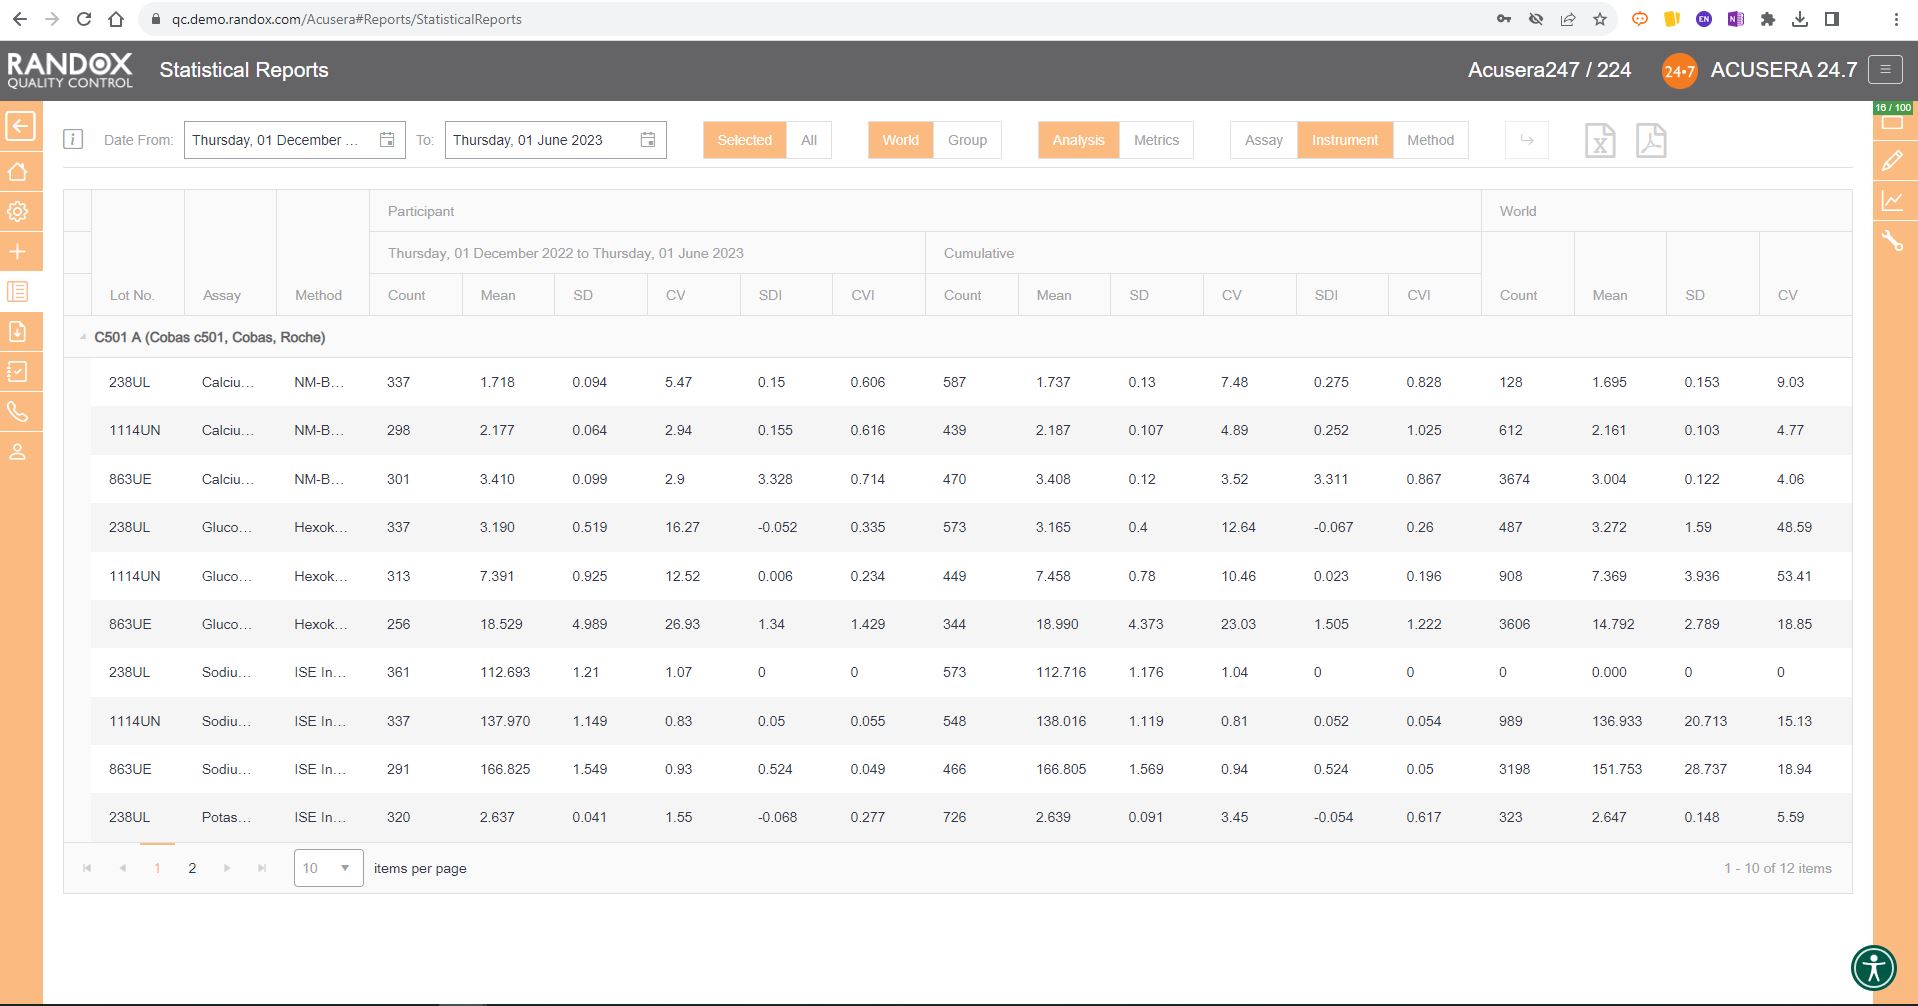
The first report we will look at is the statistical analysis report. This report allows you to view your IQC data from a specified date range, and compare it to your cumulative data, that is, all the IQC data you’ve collected since you began using that lot, as well as the peer group data for the same lot all within one screen. If you are part of a chain of laboratories, you can compare this data with your laboratory group to see how your lab stacks up by using the World/Group toggle button.
This report provides you with the count, mean, SD, CV, SDI and CVI for a lot and can be organised by assay, as shown in the image below, instrument, or method, allowing you full freedom to customise this report to suit your needs. Don’t forget, like all our reports and charts, this data is fully exportable to PDF or Excel for filing or data review.
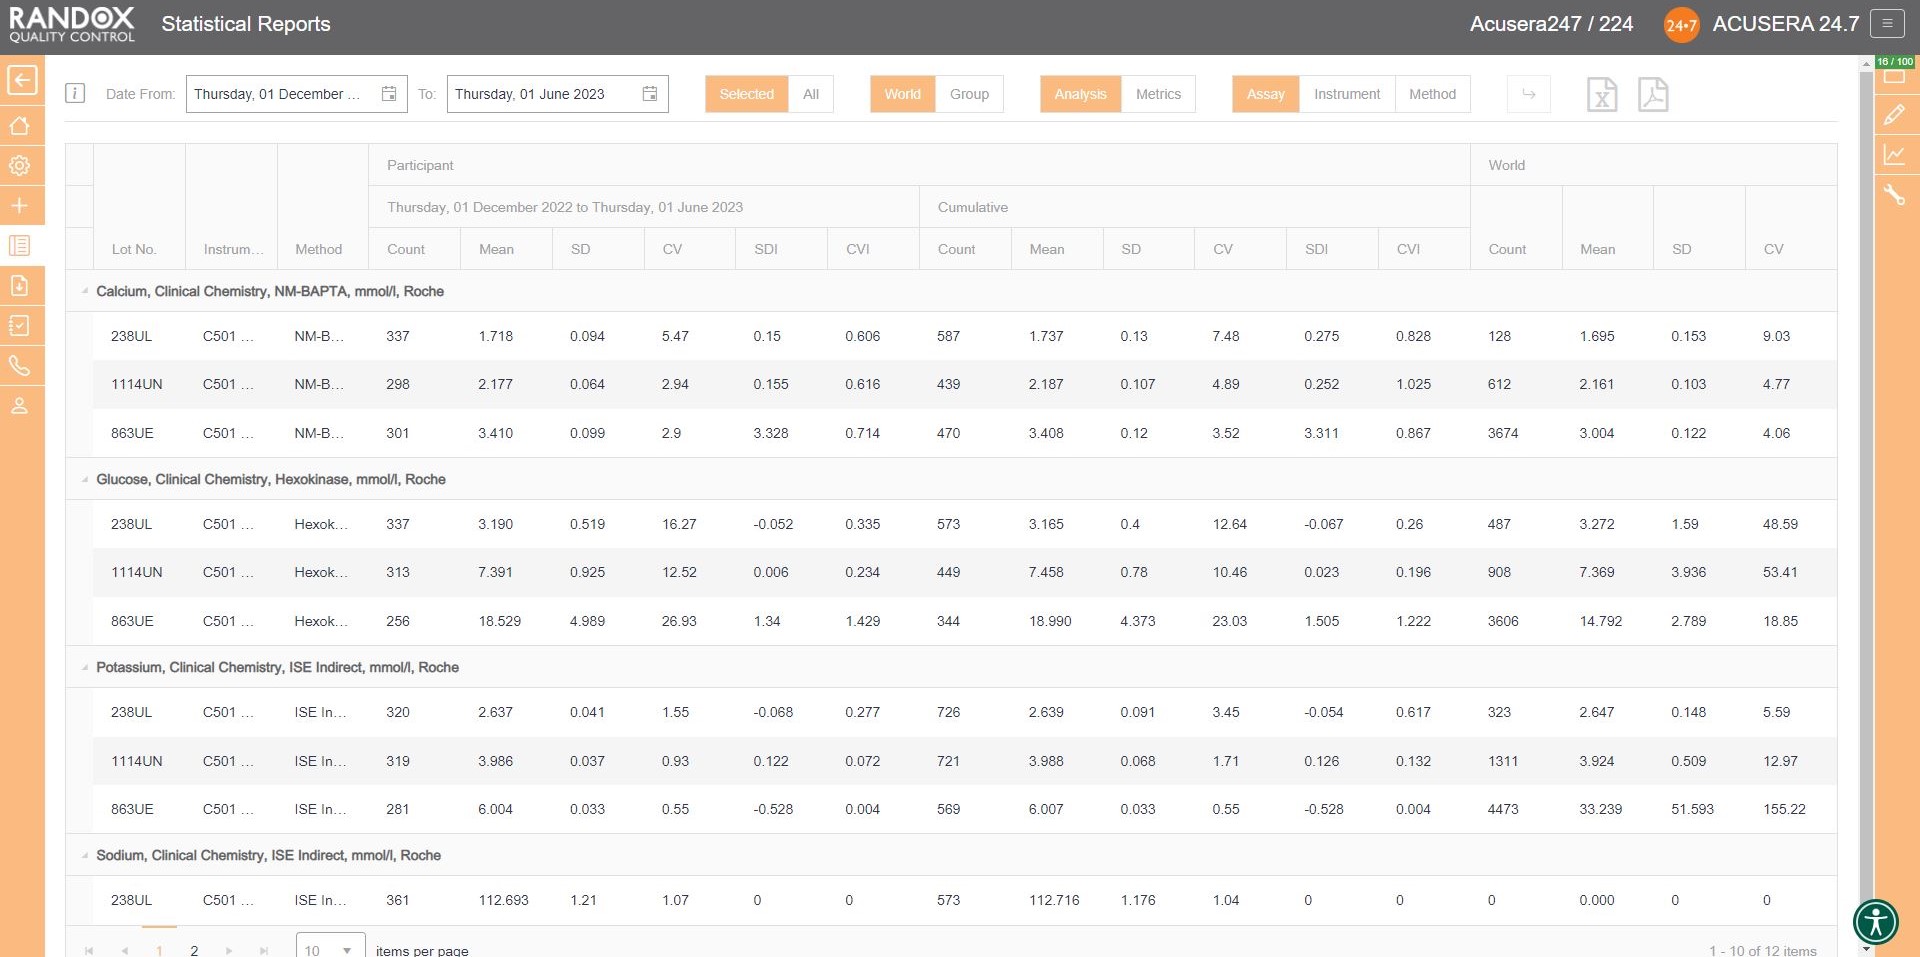
Handy, right? This report provides you with everything you need to carry out the validation and verification of new IQC lots, plus much more. We’ll look at this in more detail in an upcoming article.
Exception Reports
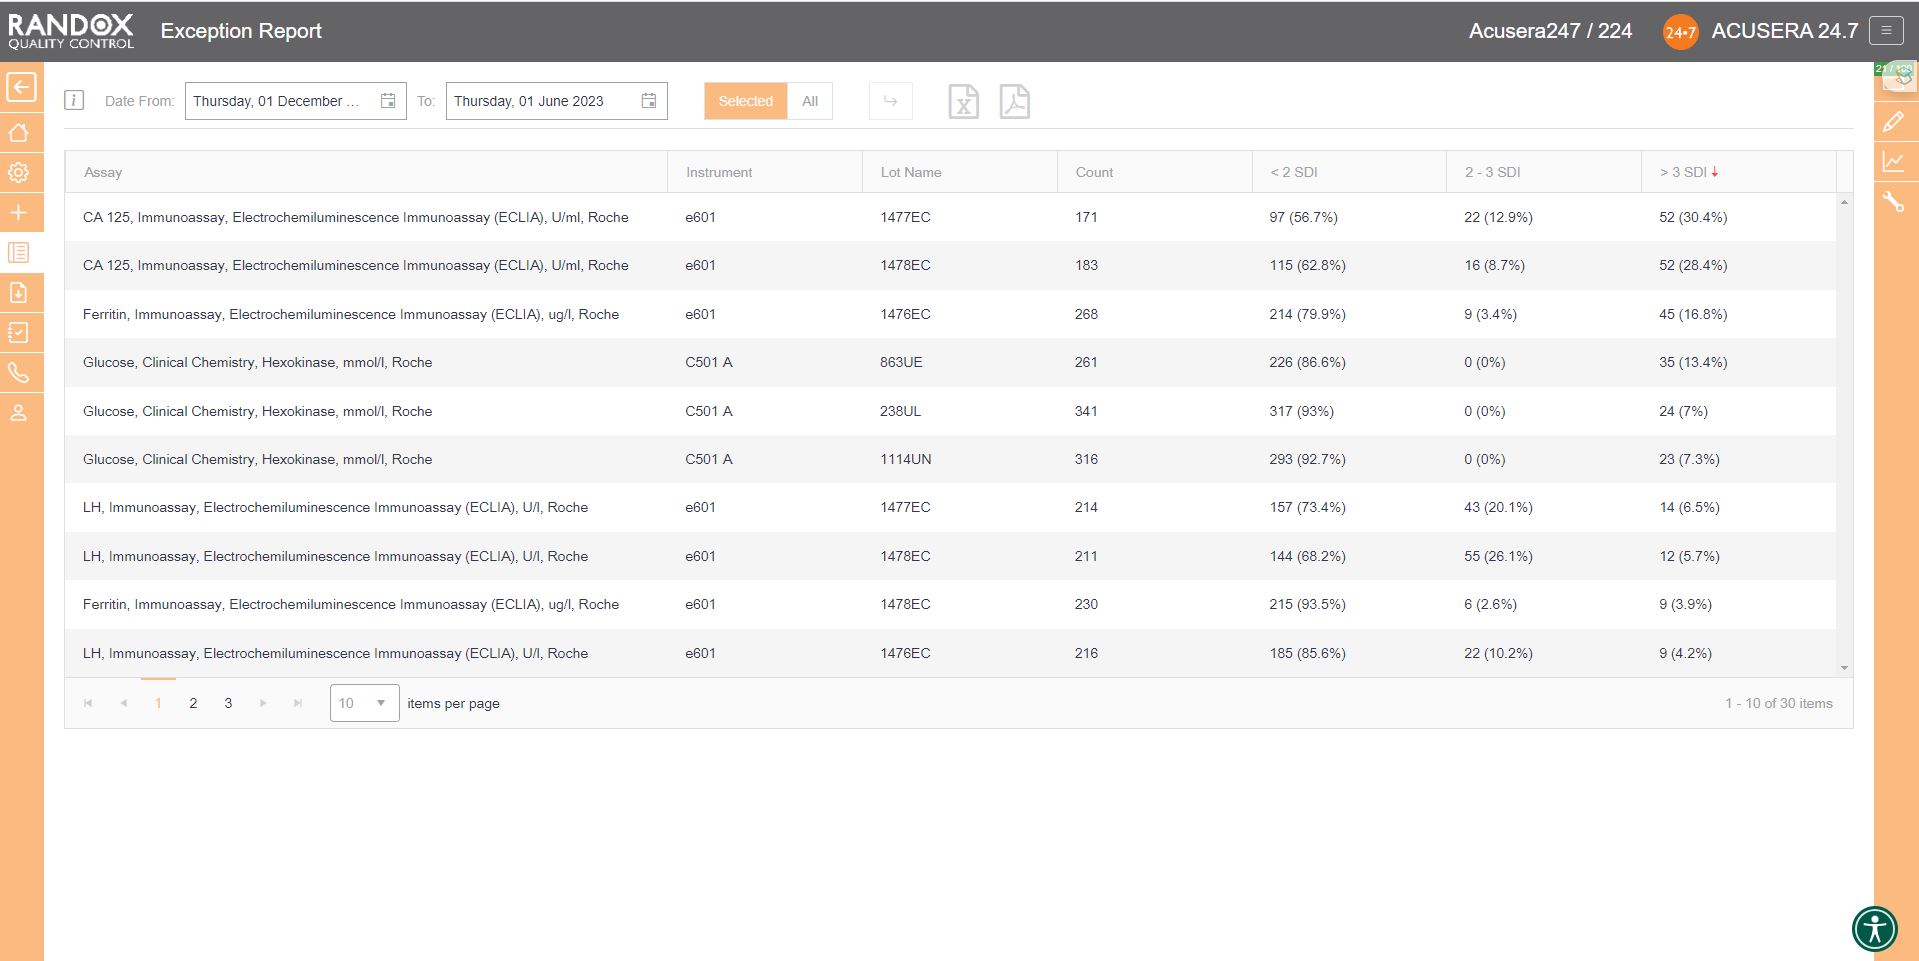
If you wish to determine your best and worst-performing tests, our exception report is perfect for you. This report is designed to quickly and easily identify assays with a high percentage of errors. The exception report provides an on-screen summary of the number of QC results for each individual assay and control lot that fall within the following categories: <2SD, 2-3SD and >3SD. This comprehensive performance review can be filtered: by clicking on the top of the ‘>3DSI’ column, this report will display assays in descending order with your worst-performing assays at the top, as shown below.
Filtering by ‘<2SDI’, it will display the same data with your best-performing assays at the top.
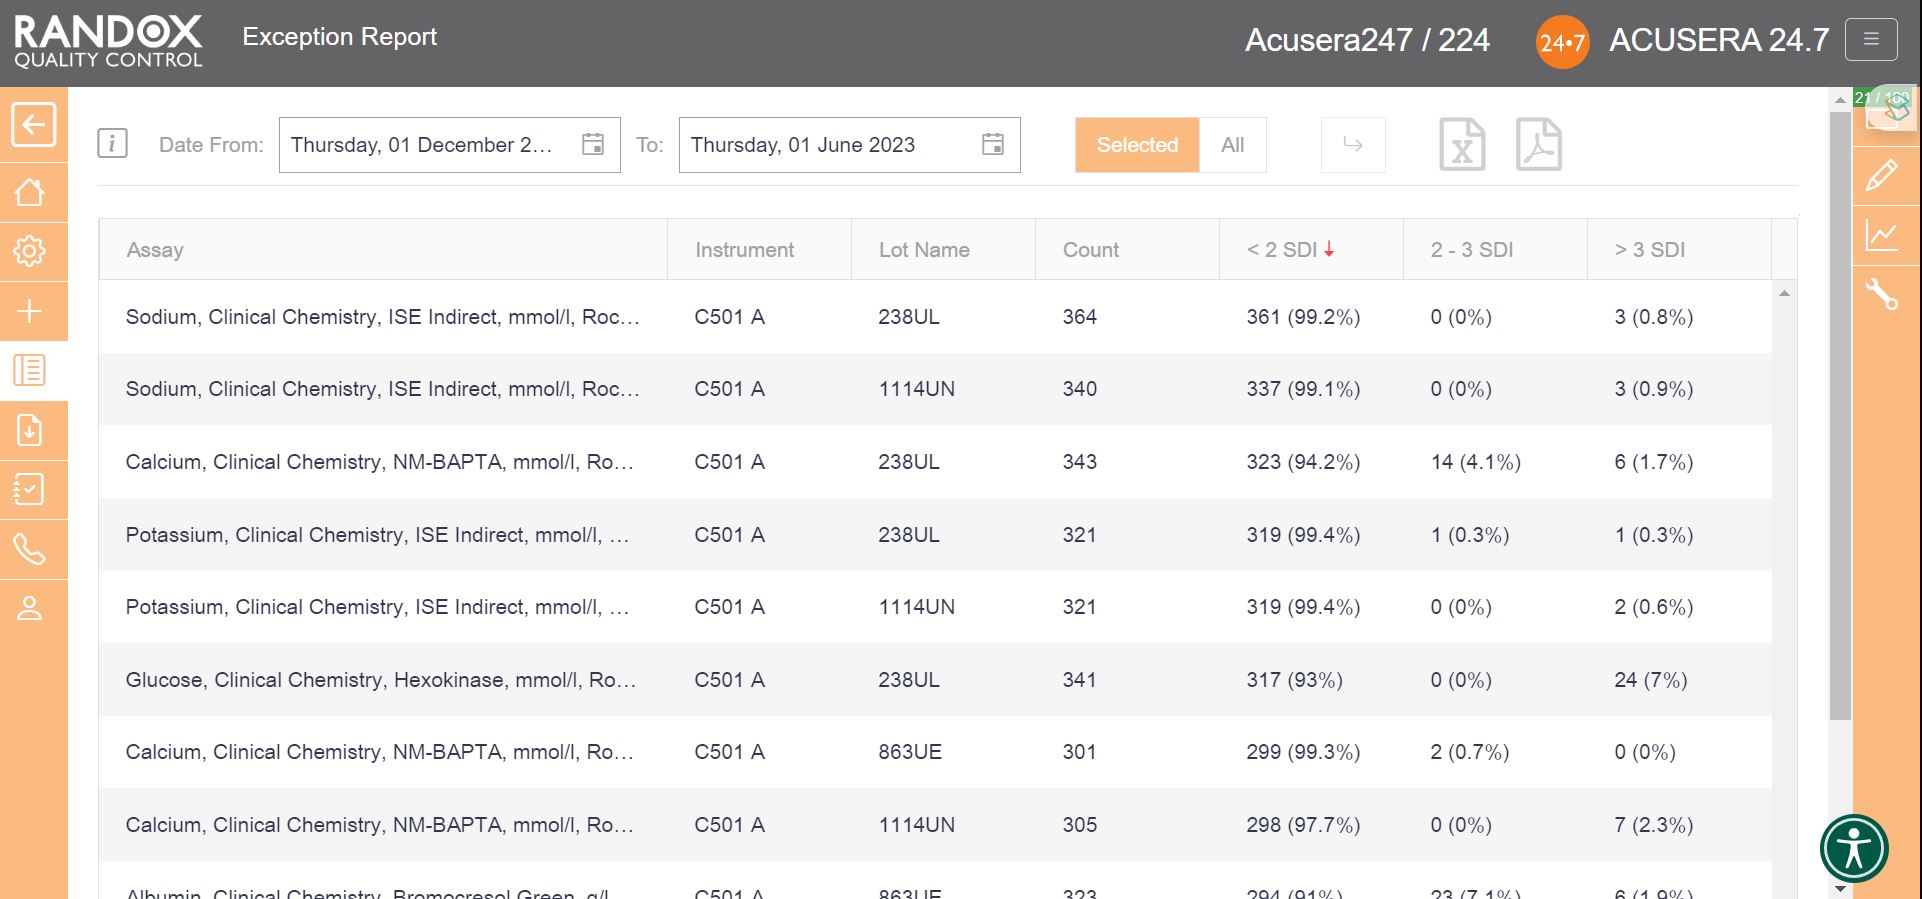
With this information, you can determine in which of your assay’s failures most often occur and encourage staff to look a little more closely at why failures arise and identify changes to improve and minimise errors.
Peer Group Statistics Reports
Now that you have figured out the performance of your assays, you’ll want to see how you compare with others running the same tests. Our Peer Group Statistics Report is your new best friend.
Updated live and in real-time, with no submission deadlines, you can compare your statistics to those of your peer group, determined by analyte, method, instrument manufacturer and model.
Simply select the IQC lot you wish to analyse and Acusera 24.7 will generate the data for you, displaying the count of QC data, mean, SD and CV, giving you comprehensive insight into your performance vs your peers.
You can customise this report even further. If you select an analyte, we’ll show you the data for that analyte alone. If not, we’ll show you the information for all analytes related to that lot. The same goes for specifying a date range – if you choose a range, we’ll show you the data inside that range alone. If not, we’ll show you all the data for your chosen lot.
By clicking on the headers, you can filter the data – 1 click will display the data in ascending order, 2 will show you a list in descending order and 3 clicks will reset the table.

When these reports are combined with the other impressive features of Acusera 24.7, like our fully customisable charts or advanced statistical analysis, this software can help streamline your IQC procedure and data review process.
When the accreditors come knocking, others will be scuffling around trying to gather multitudes of reports and files, but you will be sitting with a smile on your face and your feet up, because you’ve got Acusera 24.7.
With full onboarding assistance and technical support that’s top-of-the-class, you’ll always have someone to help you get to the bottom of any problems that you face.
If you haven’t already booked a demo, get in touch with us today and let us show you how much time we can save you with this innovative and intuitive software. Alternatively, take a look at our Resource Hub for some material on Acusera 24.7 or Acusera IQC.
To streamline your QC Data analysis, get in touch with us at marketing@randox.com.
Charting the Course to Laboratory Excellence
Are you still using spreadsheets for your QC data and Charts?
You’ve been left behind.
But don’t worry!
Your laboratory’s ultimate ally in the quest for precision and excellence has arrived.
Acusera 24.7 is a tool that not only streamlines your QC data but also empowers you with a treasure trove of invaluable charts.
These charts are more than just numbers and lines; they are your secret weapon for troubleshooting, achieving accreditation, and driving continuous process improvement.
Acusera 24.7 doesn’t just offer charts. It offers a symphony of insights at your fingertips. From the precision of interactive Levey-Jennings charts to the competitive edge of performance summary charts for peer group comparison, from the rhythm of weekly mean charts to the clarity of reliable SD histograms – these charts are your compass in the world of quality control.
The best part?
You’re in control.
Tailor these charts to your unique needs, whether you’re dealing with single or multiple analytes, an abundance of QC lots, fixed or variable SDs, or need to pinpoint data within a specific date range.
Join us on a journey through the world of Acusera 24.7’s charts, where data becomes your strategic advantage, and discover why more laboratories are choosing Acusera 24.7 for QC data management every day.
Levey-Jennings Charts
Every laboratorian has seen countless Levey-Jennings charts and for good reason.
These charts are the unsung heroes of quality control in the laboratory.
They offer a visual snapshot of data over time, helping to detect trends, outliers, and systematic errors that might otherwise go unnoticed. Levey-Jennings charts are like the heartbeat monitor of your laboratory, providing real-time insights into the health of your analytical processes.
We’ve taken Levey-Jennings charts to the next level.
Our colourful graphs might look like they belong in a modern art museum, but trust me, they’re more than just eye candy.
Acusera 24.7’s Levey-Jennings charts are like the laboratory’s personal detective, sniffing out anomalies and shifts and making sure your QC data behaves.
Let’s have a look at what you can do with the Acusera 24.7 interactive Levey-Jennings charts.
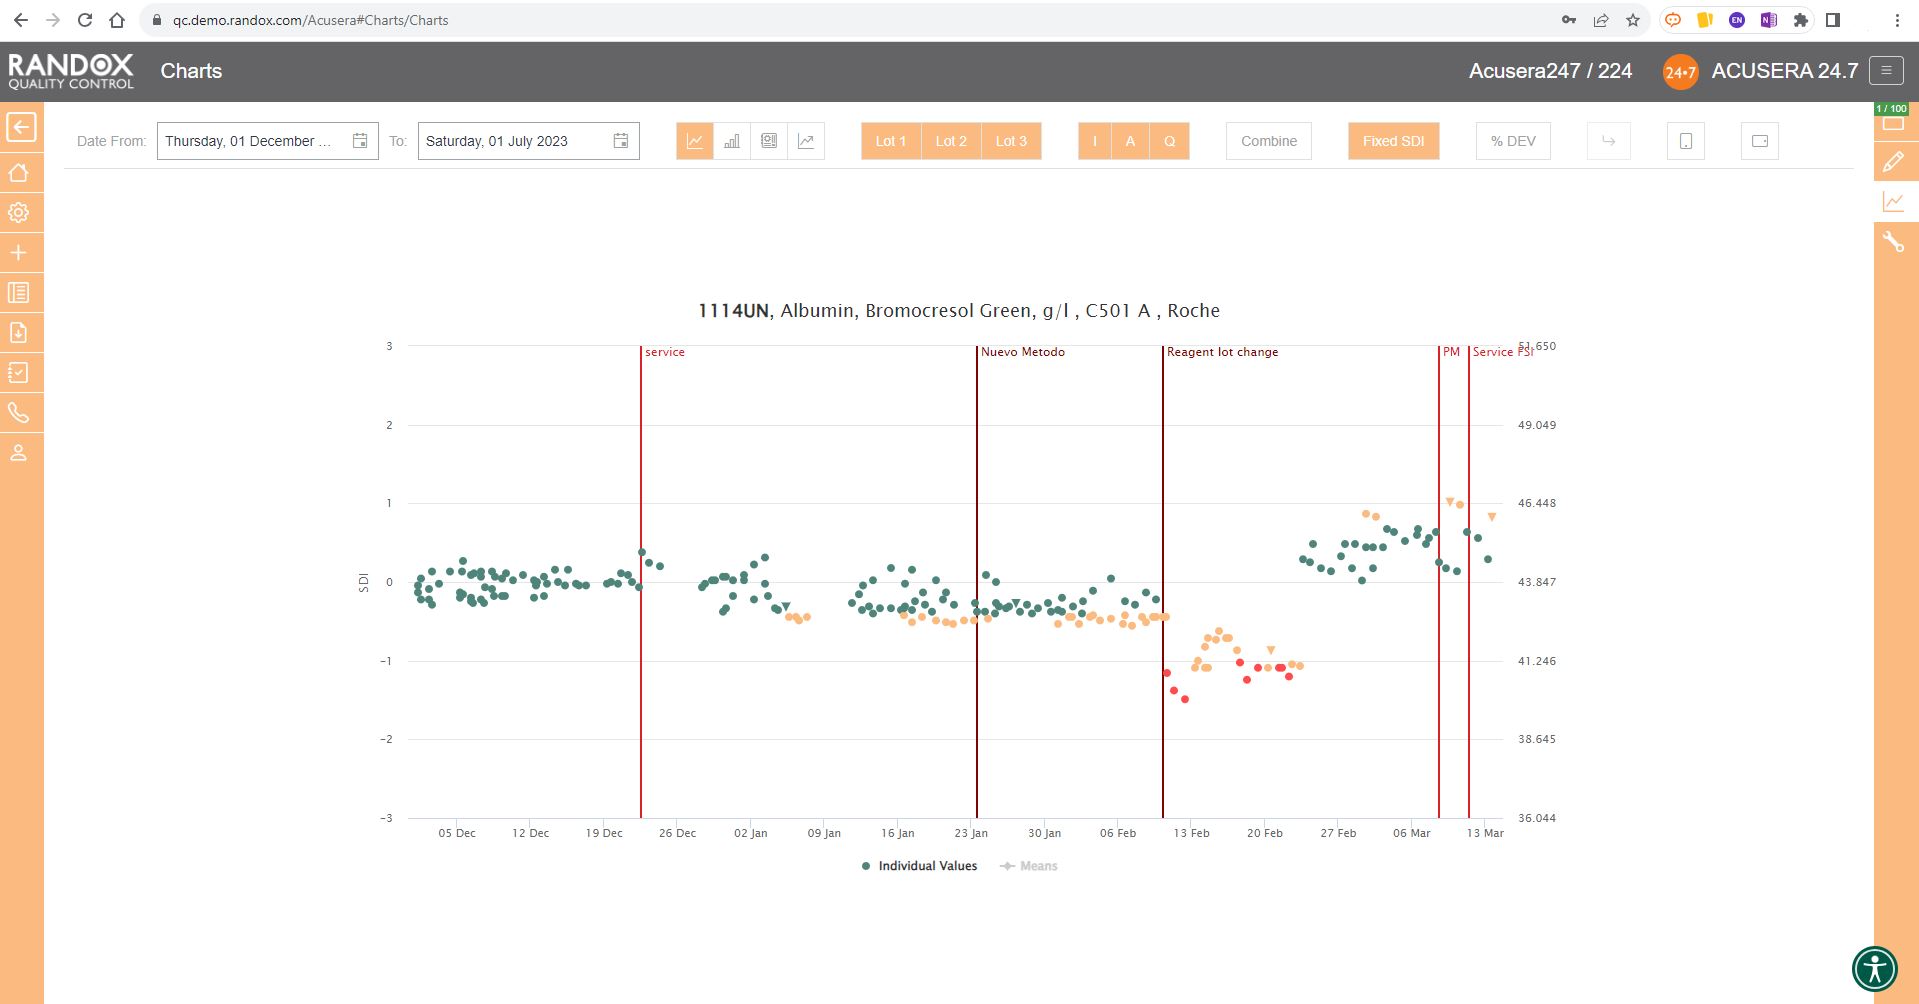
The screenshot below shows a Levey-Jennings chart for a single analyte, with the date on the X-axis and SD on the Y-axis. On this chart, you can see data points displayed in different colours. Green data points indicate an acceptable result. Orange points show data that has triggered your predefined alert criteria, while red points are those that have broken your set rejection rules.
The lines marked on the chart below represent events that have been recorded. Instrument events such as calibration events or maintenance can be recorded to monitor their effects on your QC, allowing you to quickly see how these events relate to any deviations or improvements in your QC data. For example, after the event labelled ‘Reagent lot change’ you can see a series of alerts and failures. Marking this event on the chart allows for an at-a-glance explanation of this deviation. These events are completely customisable so you can record any relevant information you want!
Finally, data points that appear as a triangle indicate a comment has been added. What text is included in the comment is completely up to you!
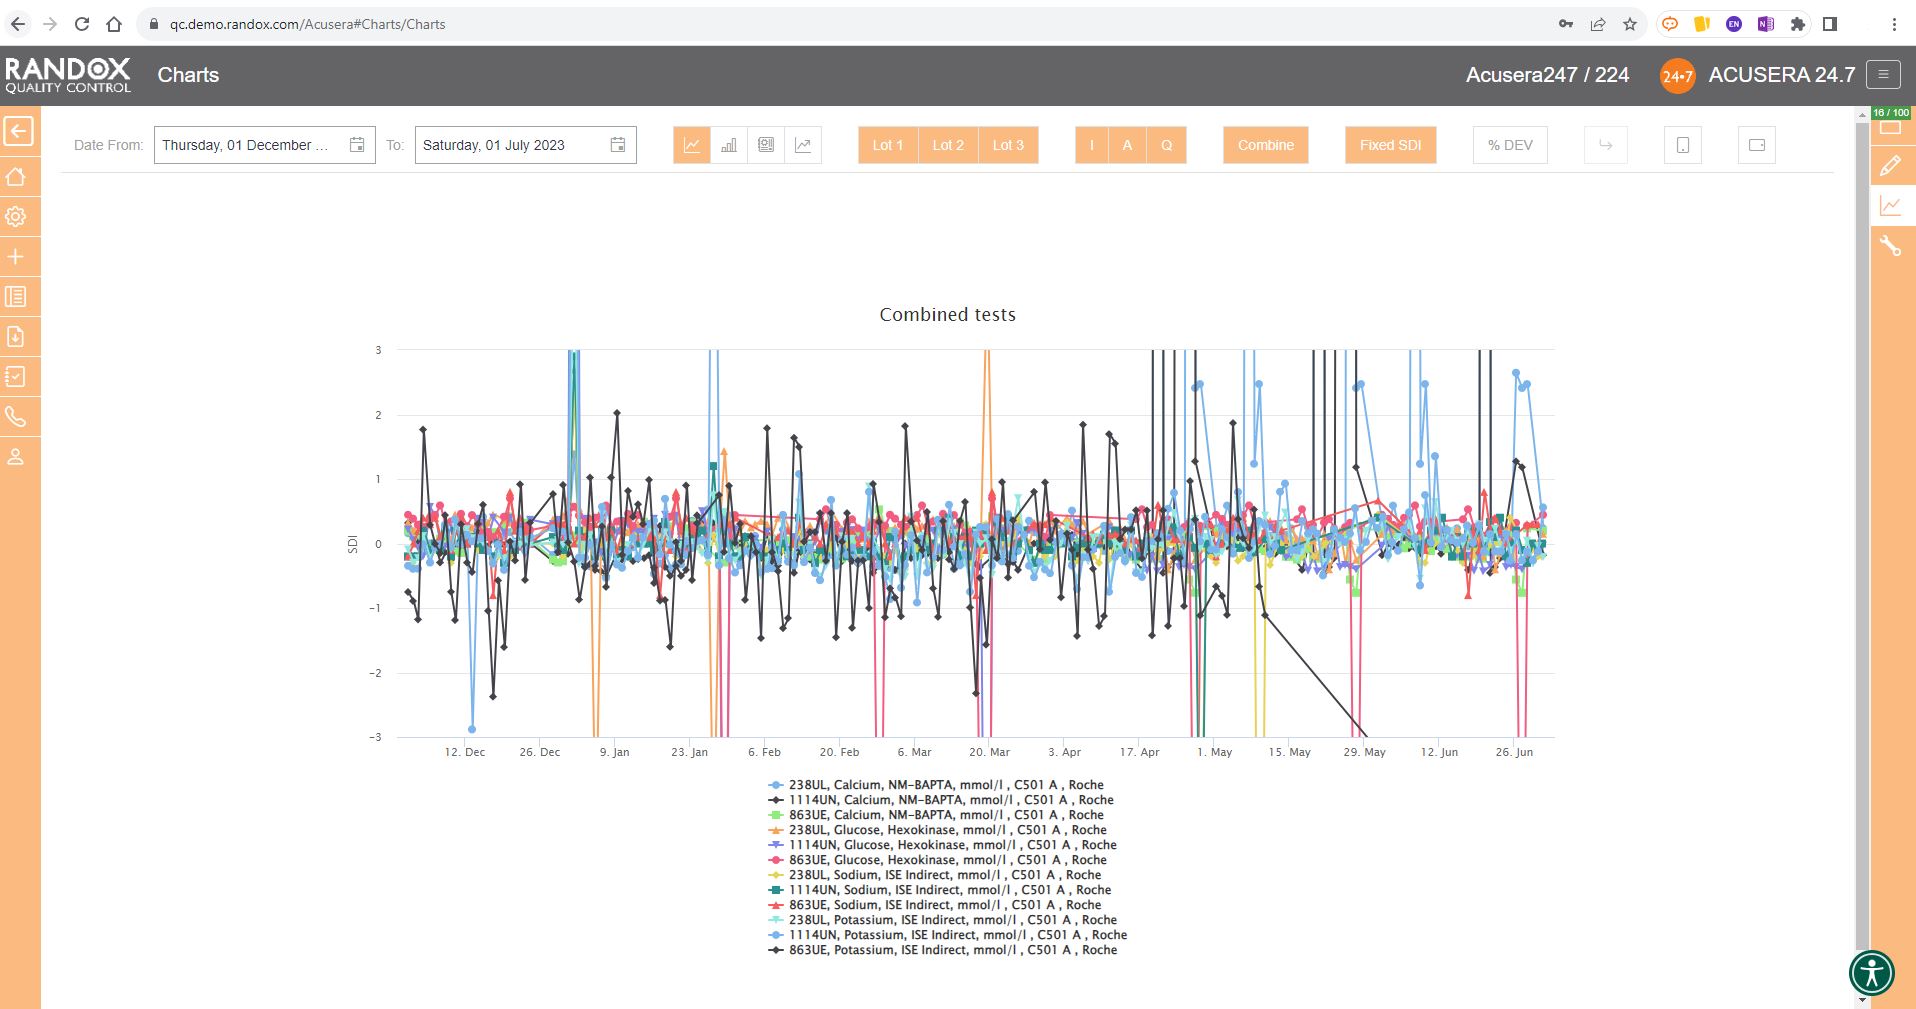
The next screenshot below shows a Levey-Jennings chart containing QC data for all the tests included in the Clinical Chemistry Panel.
Acusera 24.7 panels allow you to group related tests together, helping increase the efficiency of your data review.
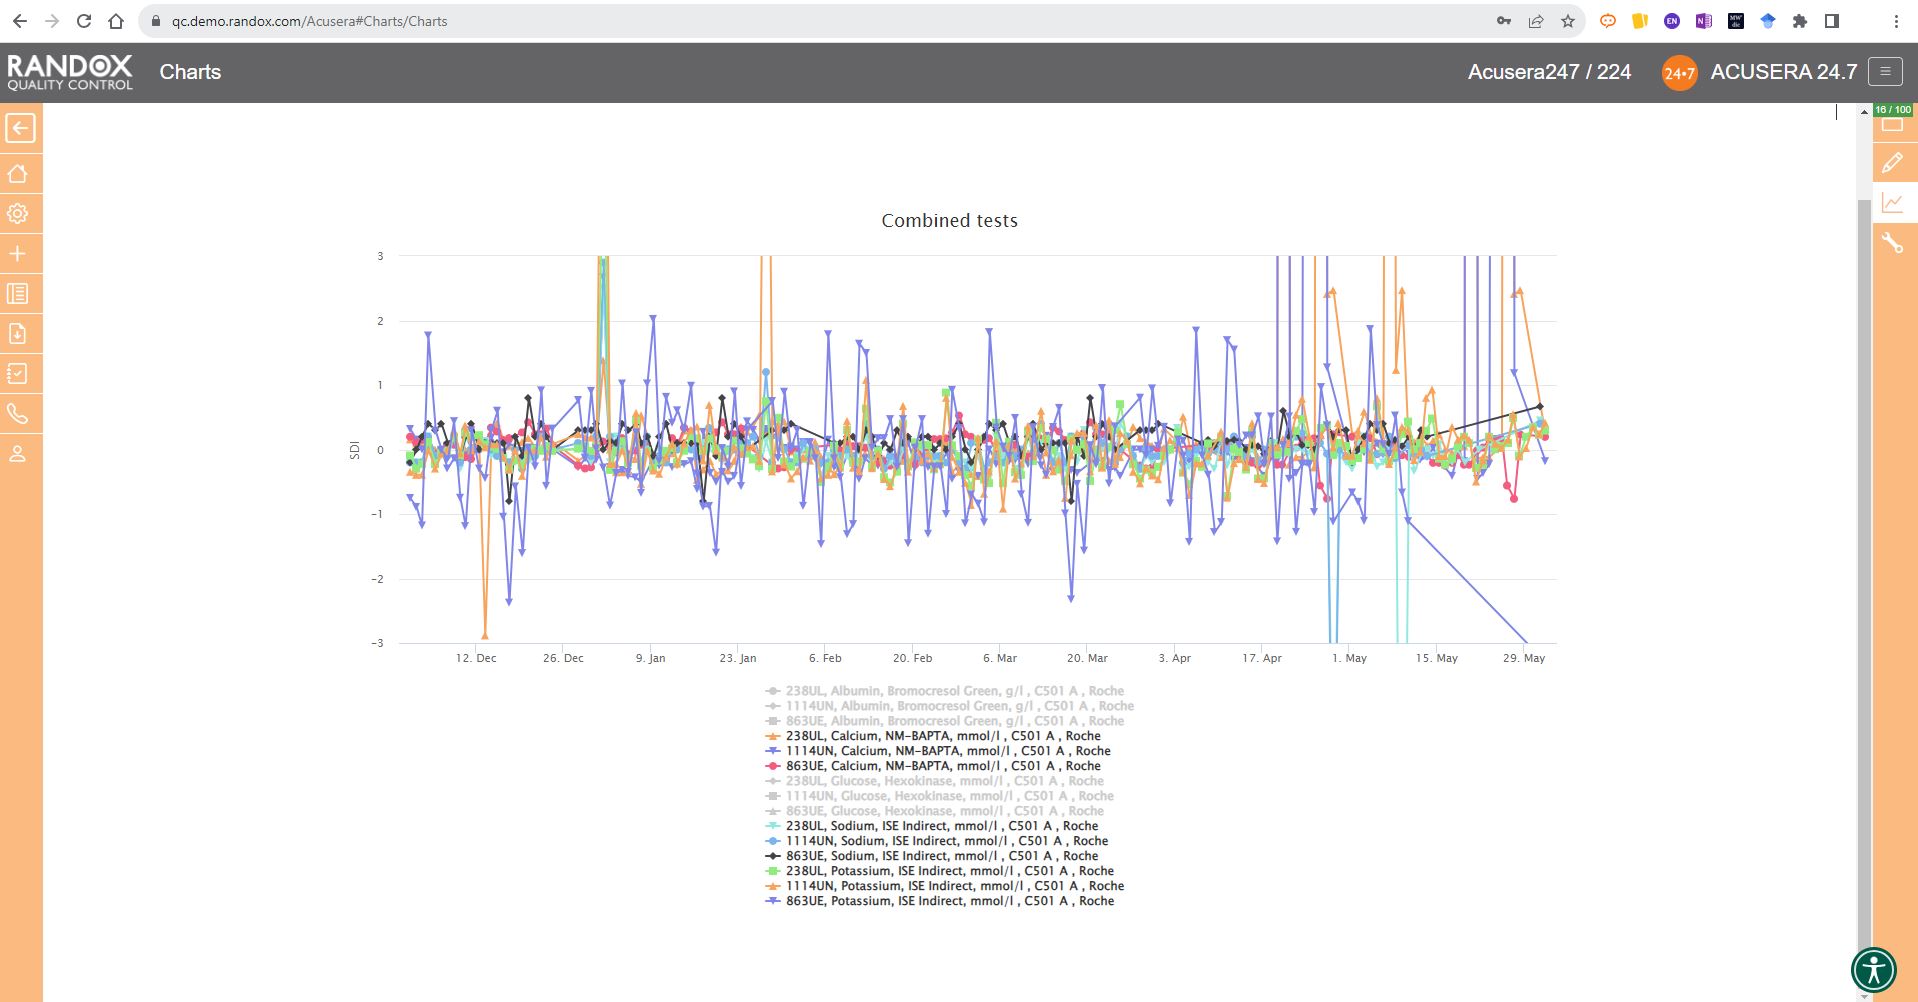
It looks great, right?
Maybe a little confusing.
The screenshot is perhaps a little deceptive.
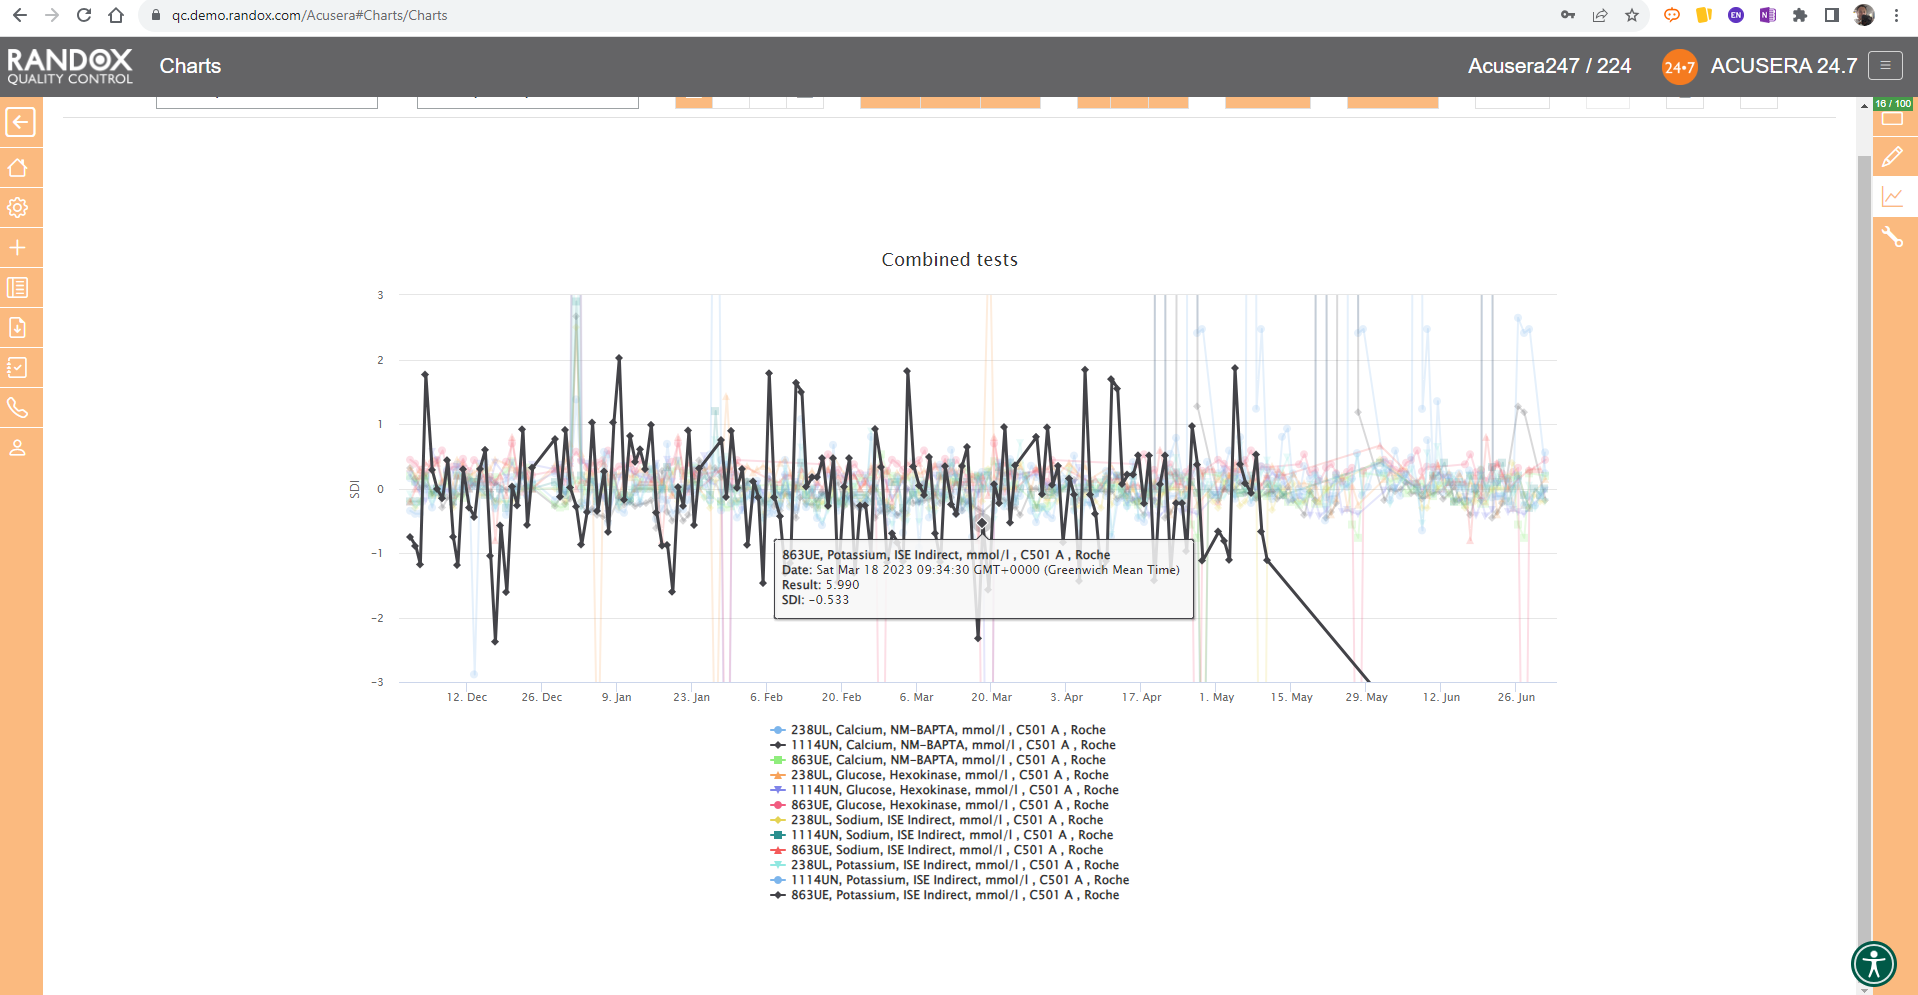
When viewing these charts live, you can view the data as a whole, or home in on individual data sets by simply hovering over the data you want to see. You can also selected a deselect datasets at will by clicking on its name in the list below the chart.
The screenshot below shows an example of this.
All the charts we’ve looked at so far have had a fixed 3SD on the Y-axis.
For a more in-depth review of your data, you may wish to expand this axis.
With the click of a button, you can expand the Y-axis to include all your data points. See below for an example.

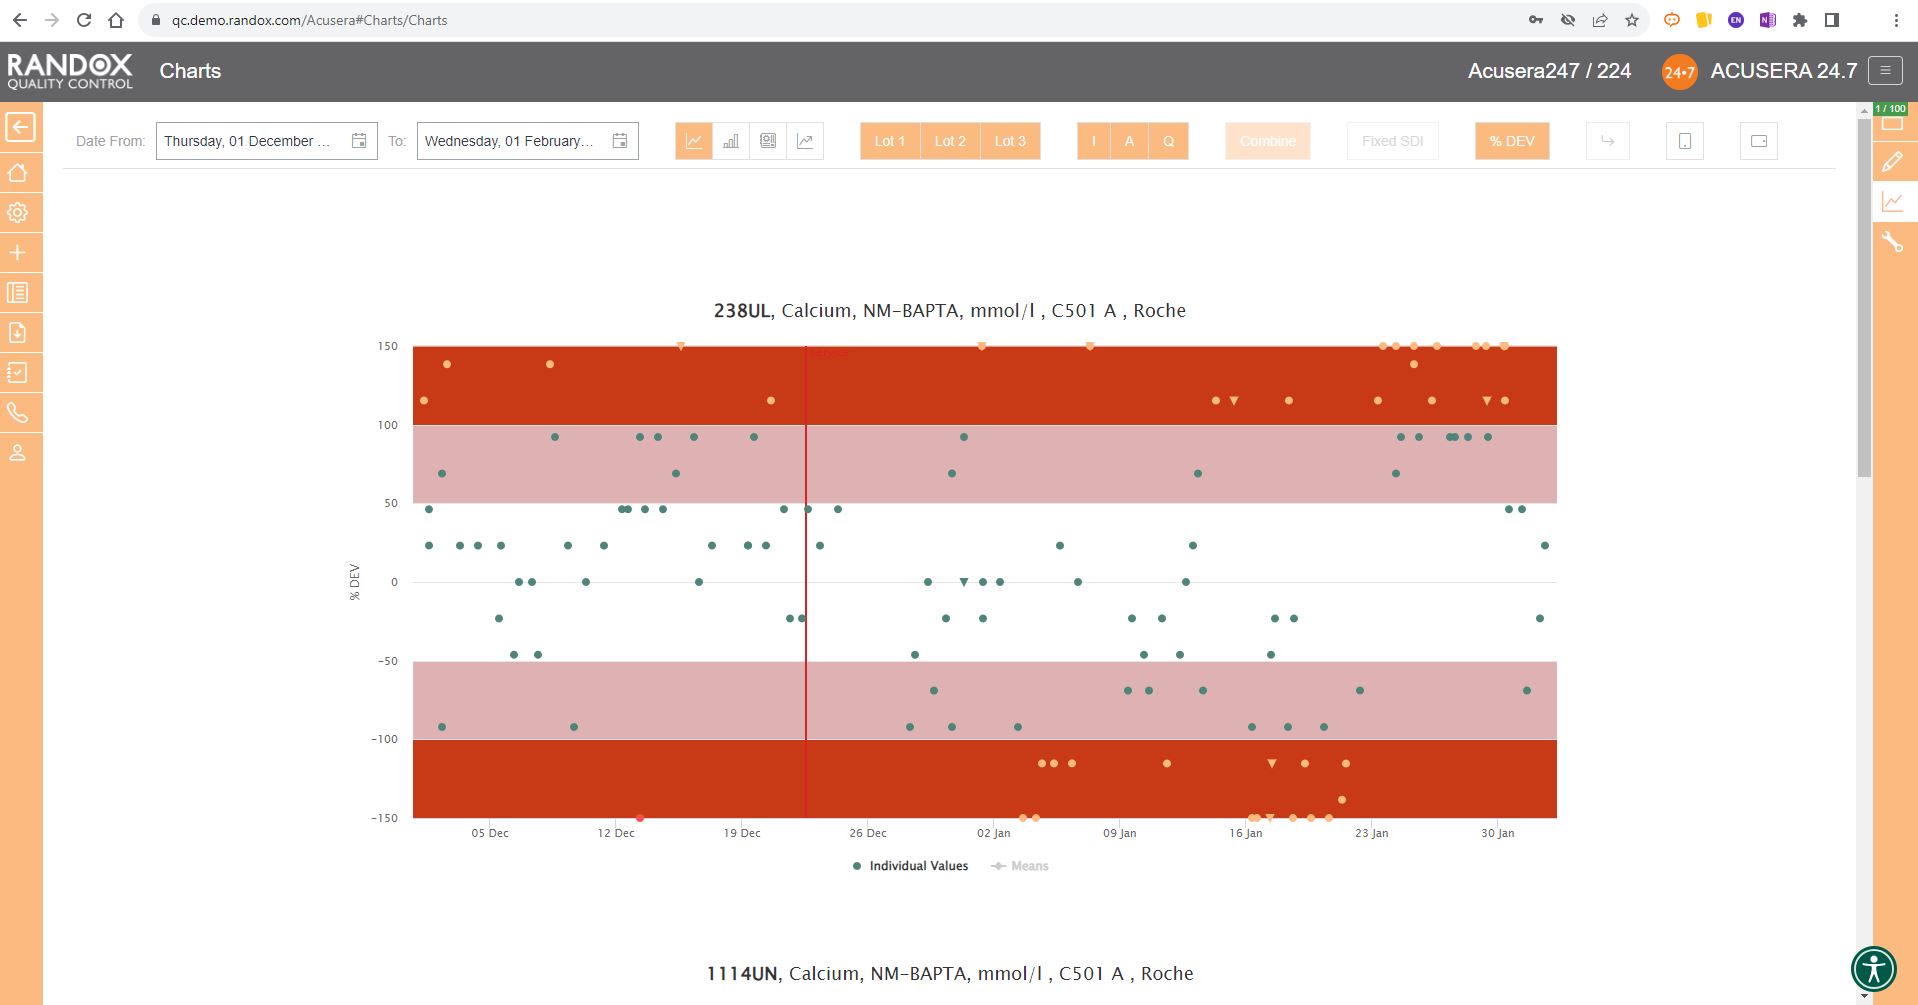
In some cases, you may wish to view this data displayed as ‘% Deviation’.
Again, with the click of a single button, you can convert the Y-axis to show just that, as shown below.
Performance Summary Charts
Peer group comparison of IQC data has a lot of benefits.
Comparing your data with other laboratories that use the same QC lot, instrument, method and more, can help you with troubleshooting and continuous process improvement.
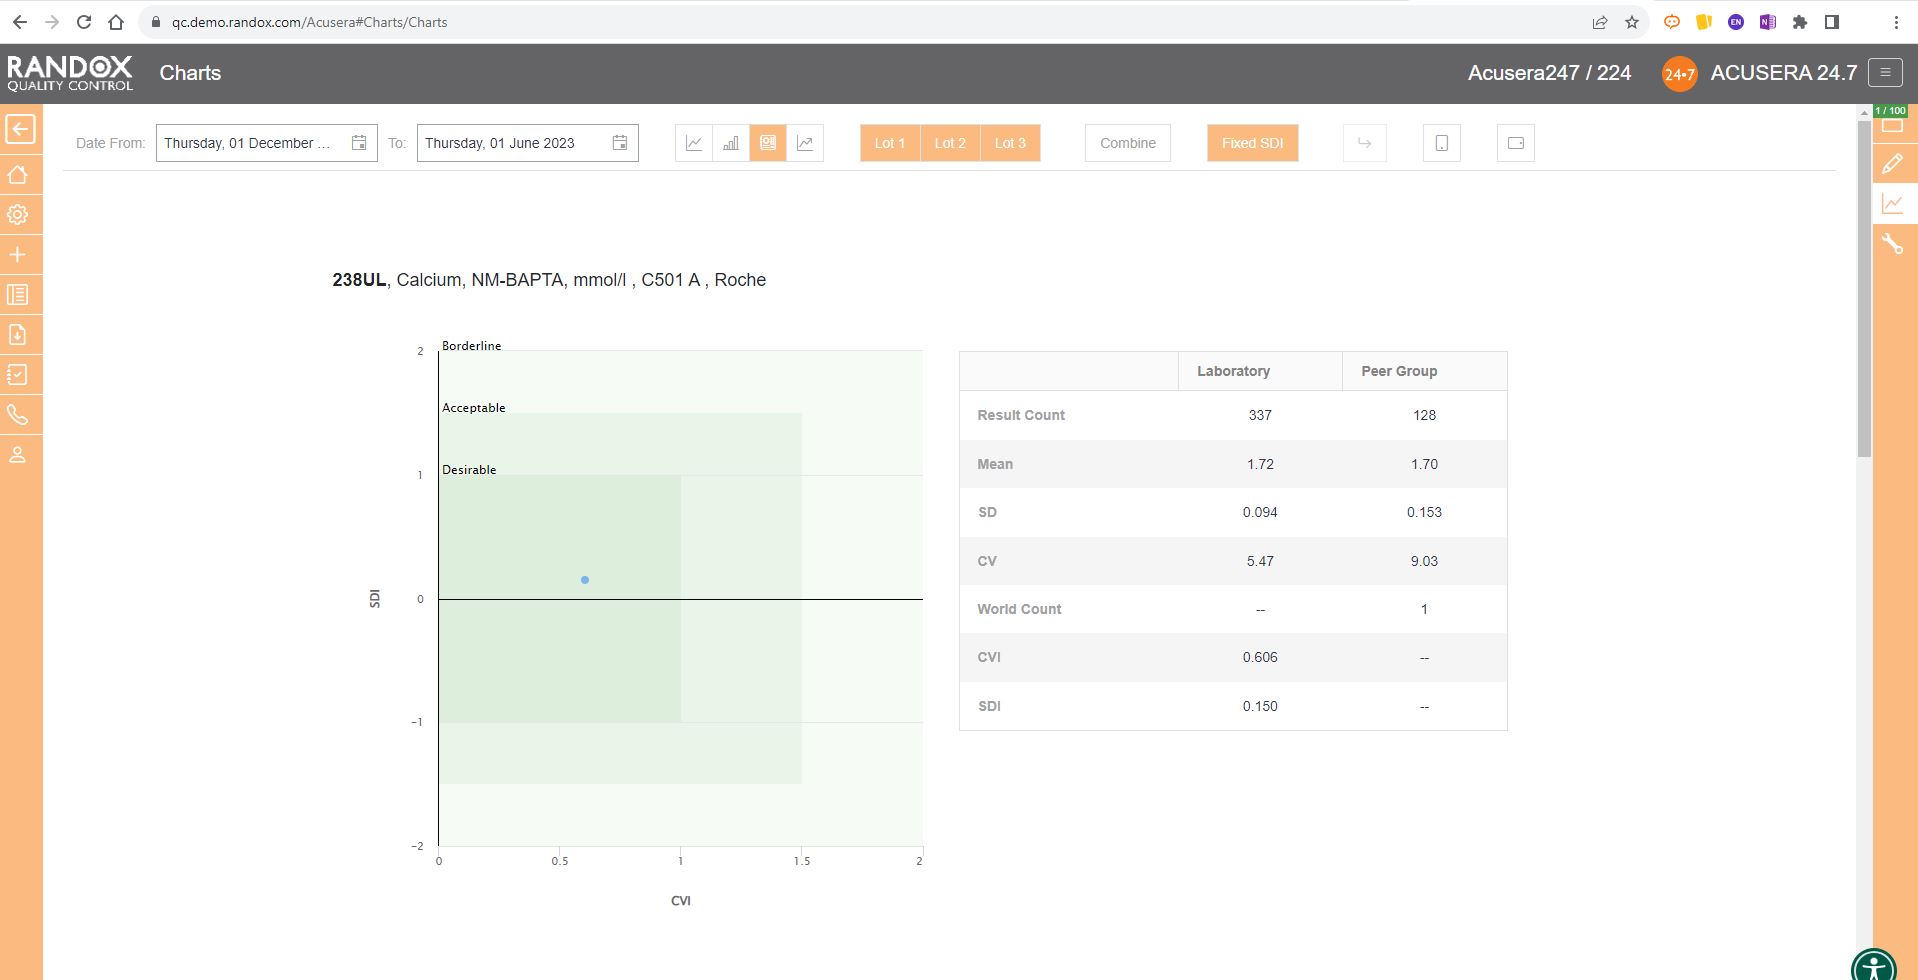
The Acusera 24.7 Performance Summary Charts do all the work for you.
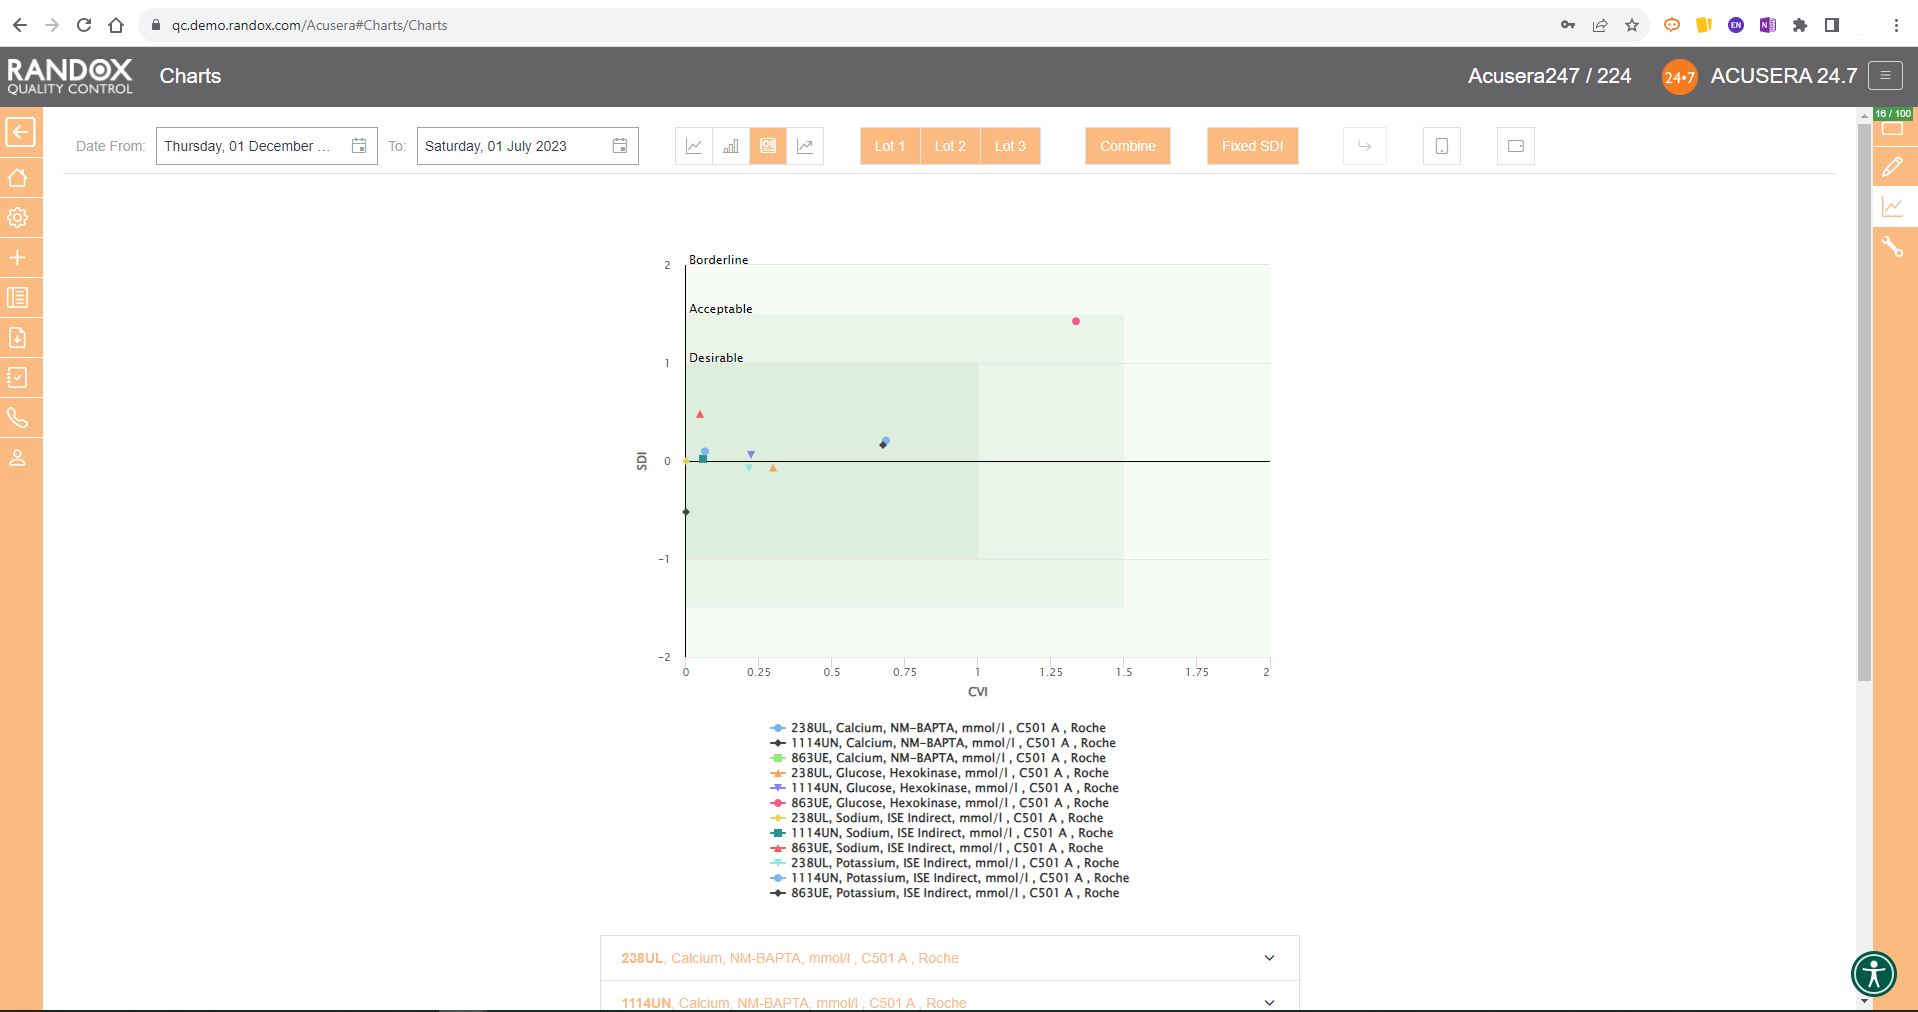
As shown in the screenshot below, these charts display your data and how it compares to your peers including mean, CV, and SD.
You can also view this data in a table to get a more detailed picture of your performance.
Like the Levey-Jennings charts, you can also combine this information for panels or a selection of multiple lots and analytes. You can see an example below:
Weekly Mean Charts
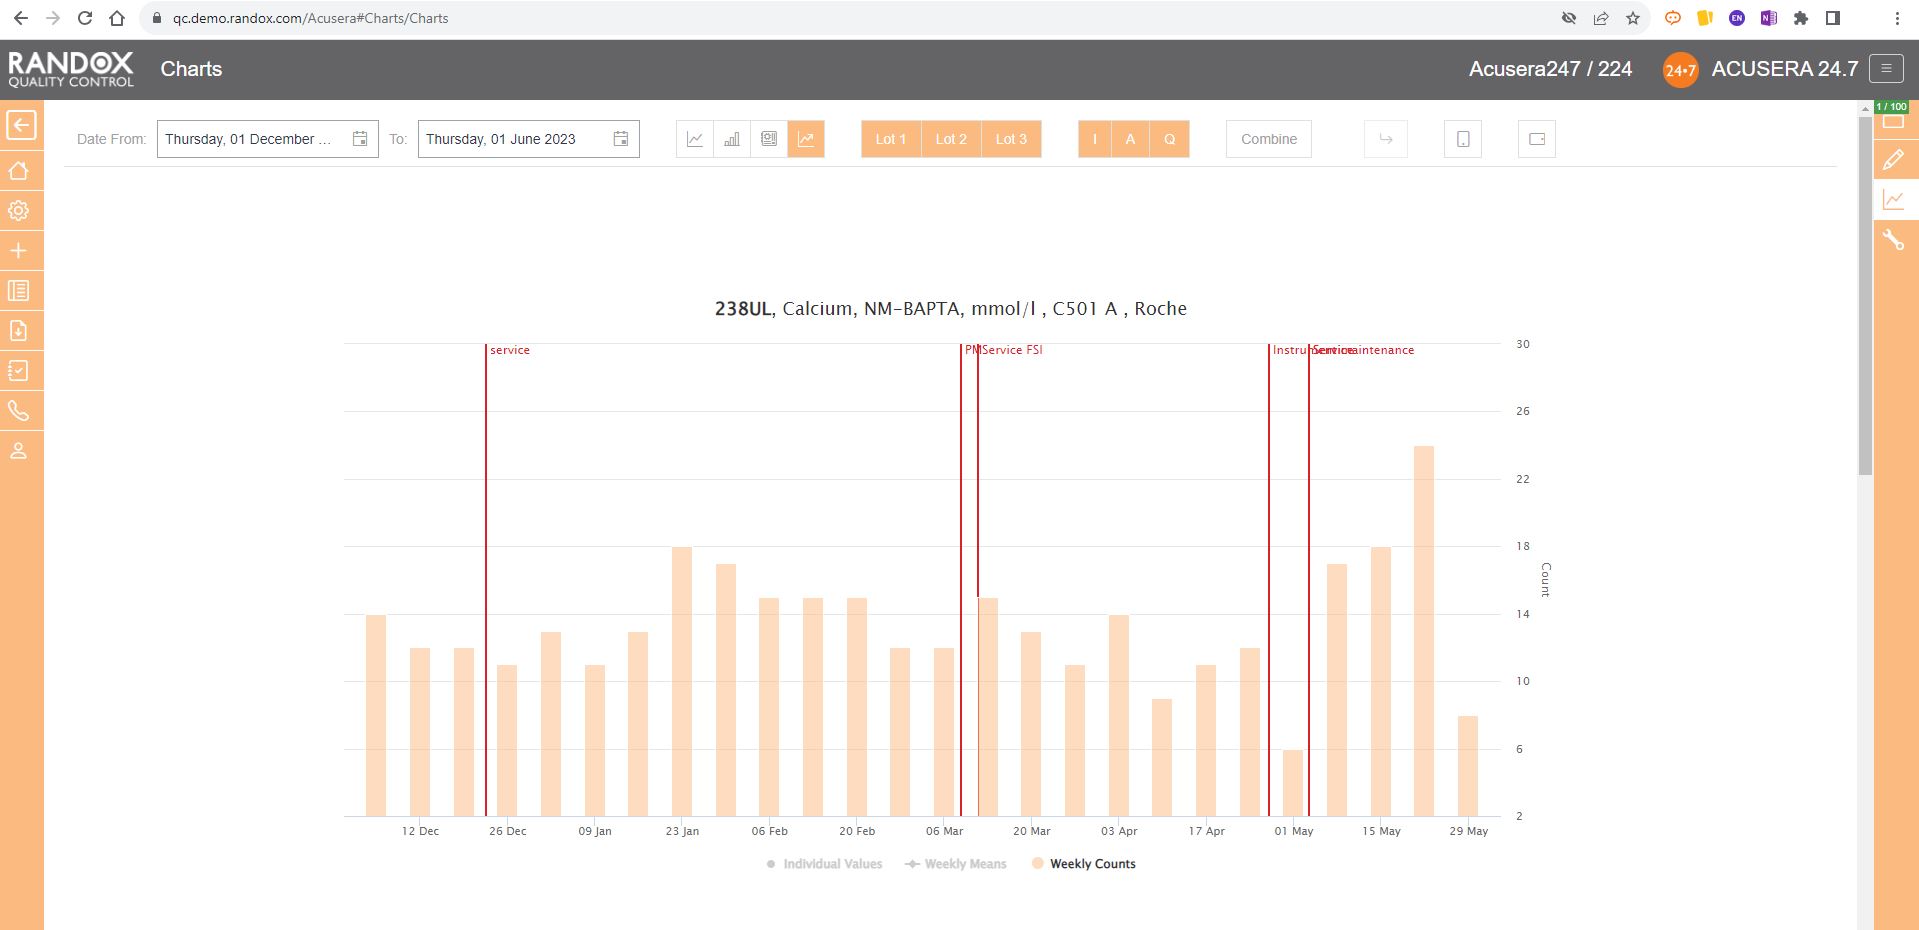
Weekly Mean Charts are one of the new features in our latest software release.
They allow you to view your weekly count of QC results for a specific instrument, assay, or lot.
Below is an example in a bar chart format.
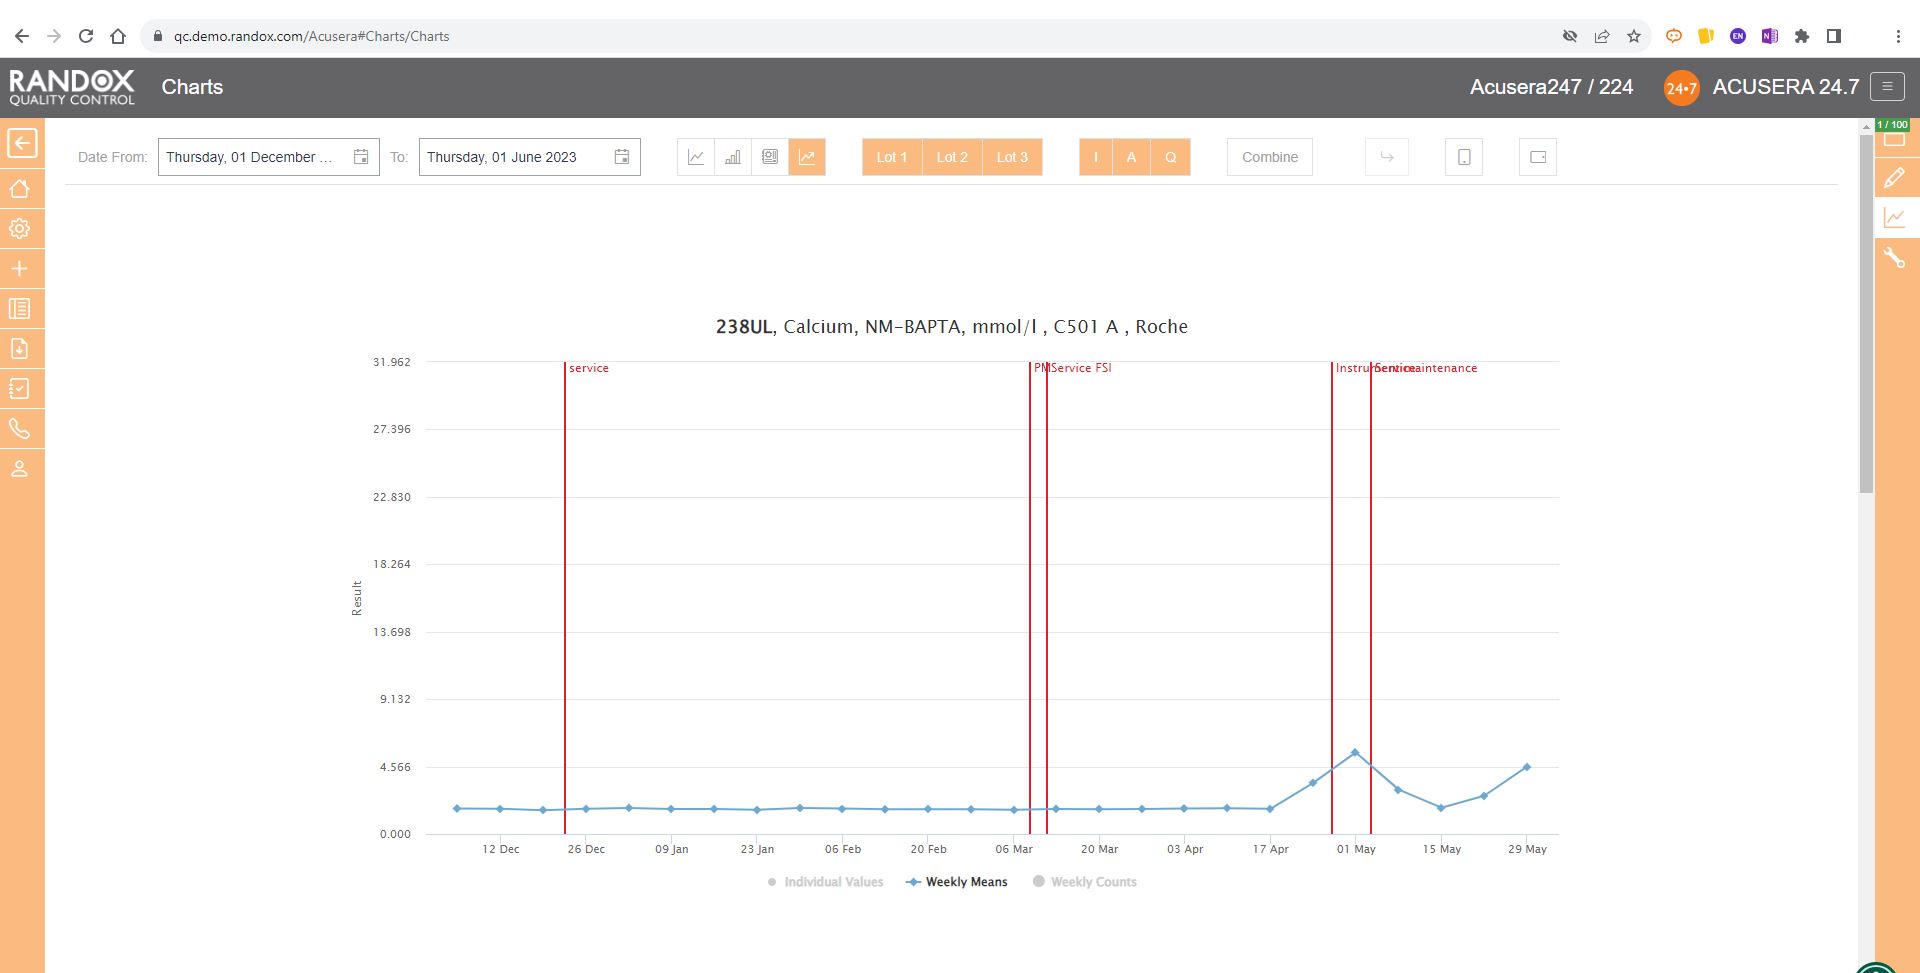
You can also view this data as a line graph, which plots the weekly mean of results from multiple instruments using the same assay and QC lot, allowing a comprehensive overview of your QC data.
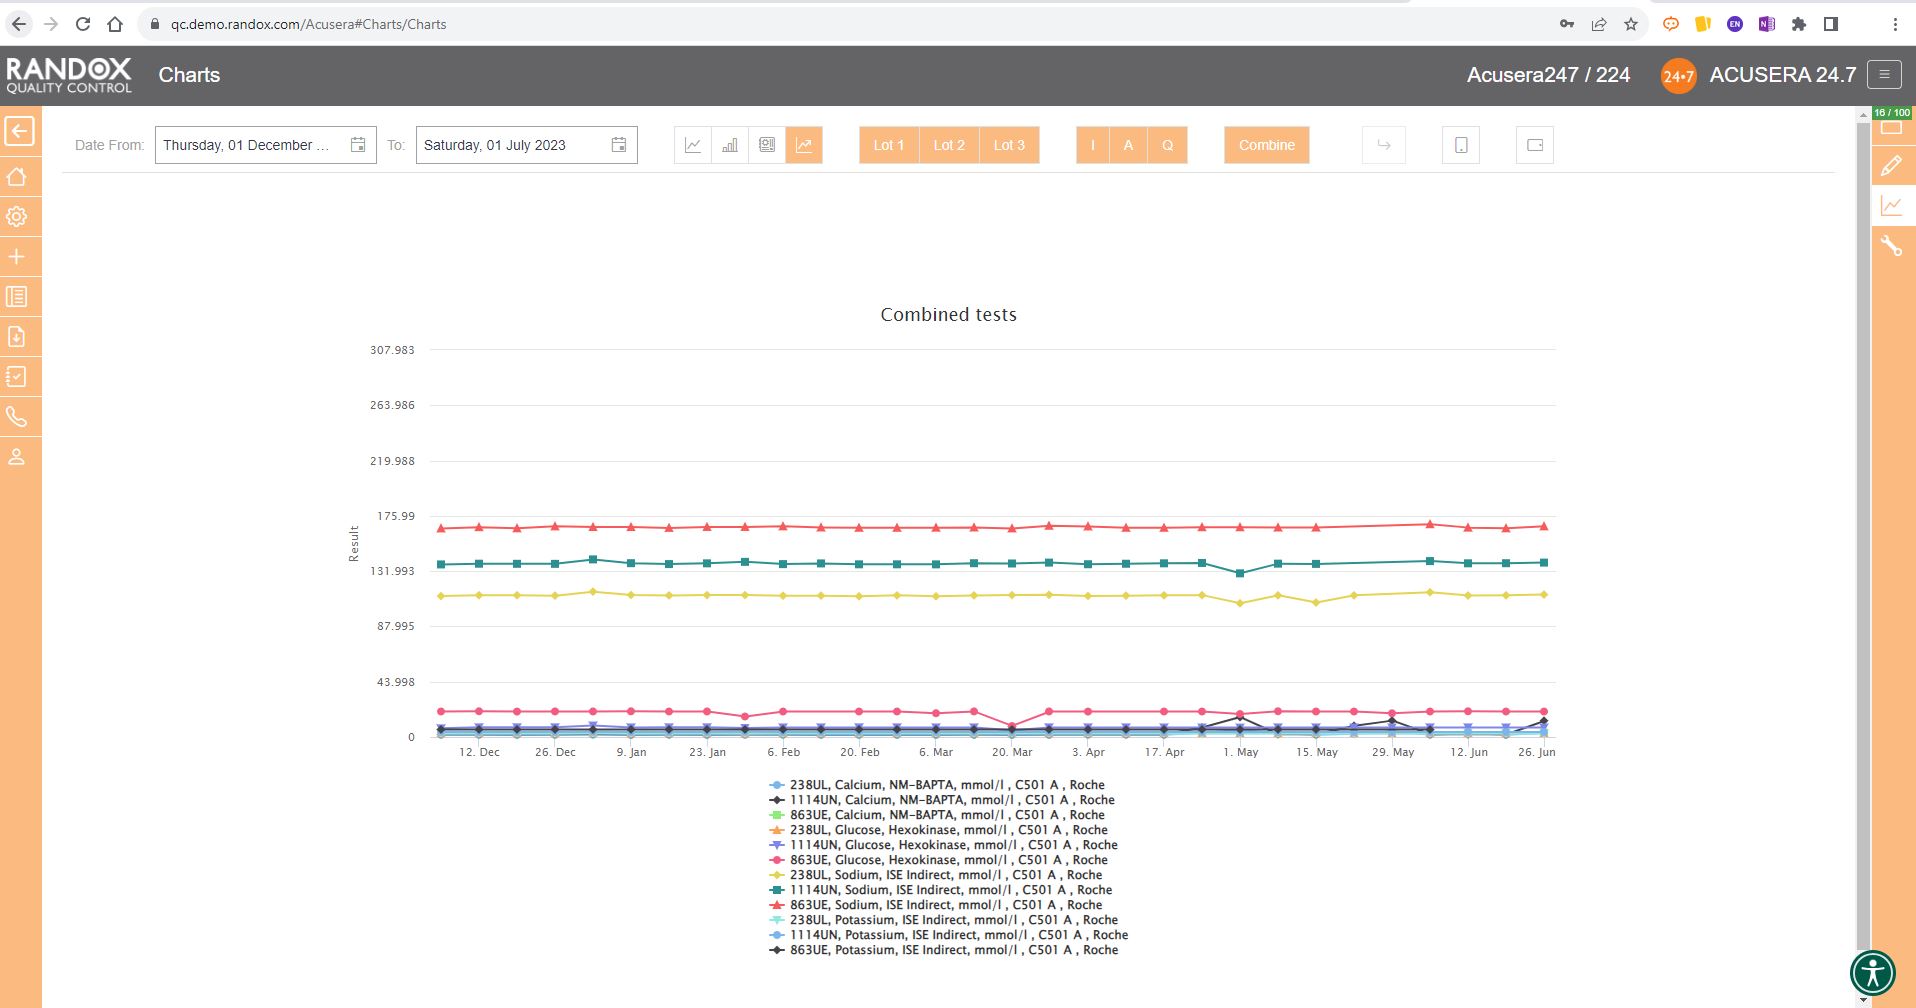
Or you can view your weekly means for a range of tests and panels.
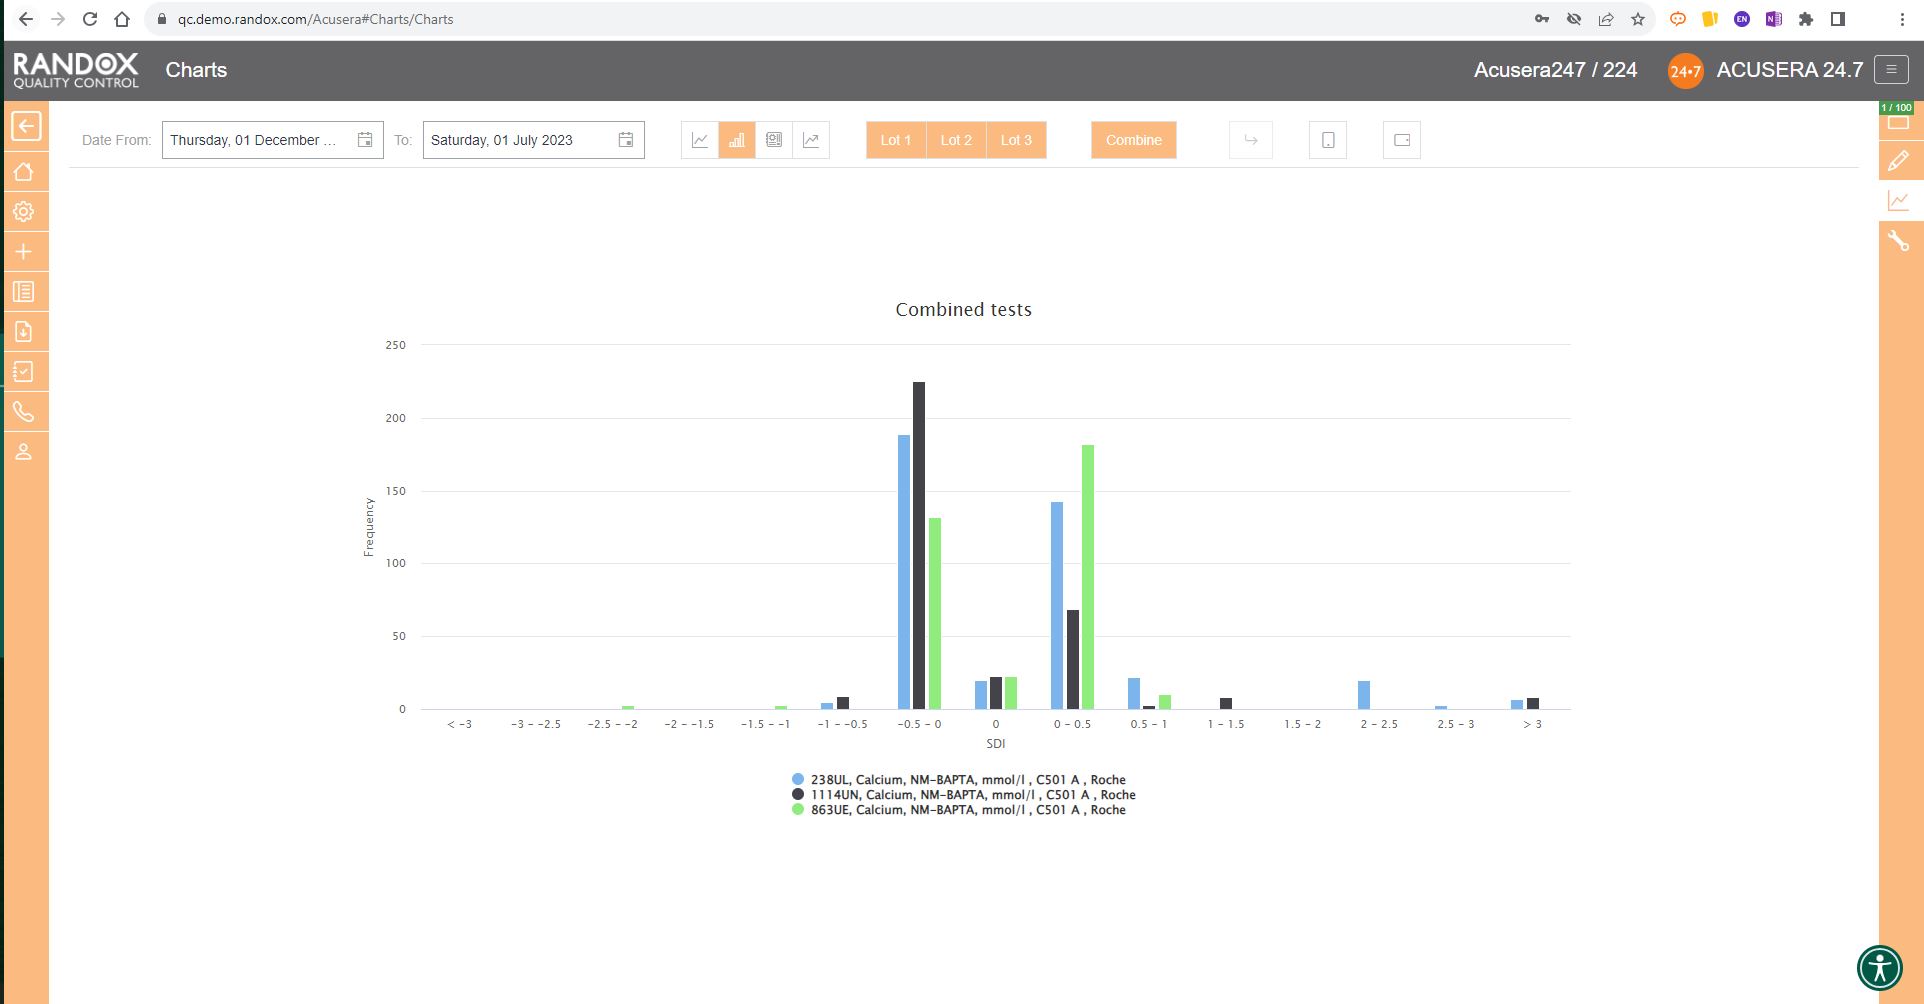
Finally, the SD Histograms allow you to view the distribution of your results, for an overview of performance.
When used with Acusera 24.7’s suite of advanced statistical tools and reports, our charts can help you reduce the time you spend investigating non-conformances.
When the dreaded accreditation assessment approaches, you can relax. While others are scrambling to find documentation, you can rest assured that all the QC data you need is easily accessible.
Assessors love to see Acusera 24.7 load when they enter a laboratory because they understand how much easier QC management is when using our software.
We provide complete onboarding assistance and full training on the software for new customers while delivering prompt and effective customer support for existing users. The Acusera 24.7 and QC operations teams are always eager to help new and existing Acusera 24.7 users with any issues they experience.
To learn more about the features of this ground-breaking software, visit our website here.
Alternatively, feel free to reach out to us at marketing@randox.com for more information or to arrange a demo!
From Fear to Freedom: A QC Data Management Revolution
What if we told you we had a solution to the multitude of monotonous hours spent analysing reams of IQC data and could provide you with an intuitive tool packed with comprehensive and customisable reports, interactive charts, and automated statistical analysis to help improve your QC data management?
Perhaps it sounds too good to be true?
This time, it isn’t.
Uncertainty of Measurement. 6Sigma. QC Multi-rules. These words can strike fear into the hearts of even the most experienced laboratory staff.
With Acusera 24.7, we’ve reached under the bed and forced the monster that is advanced statistical analysis out into the cold.
Acusera 24.7 is a live, cloud-based, interlaboratory QC data management and peer group comparison software.
A mouthful. I know.
But let’s break it down
A live, cloud-based software means you can access your QC data from anywhere, anytime.
Bid farewell to the labyrinth of folders you hunt through when troubleshooting or looking for a specific dataset.
Interlaboratory management describes the momentous task many QC managers face – monitoring the QC performance of multiple laboratories in different locations, ensuring they all maintain the high standards required for accreditation and accurate patient results.
Unlike some big-name subscription services, we encourage you to use our software at different locations to help you monitor all your laboratories and instruments to see how their results stack up against one another.
Acusera 24.7 provides multiple levels of access which are completely customisable. This allows you to grant or restrict access to different parts of the software depending on what is required by your staff. This also allows QC managers to view data from all their sites in one location without needing multiple email chains from each laboratory.
Peer group comparison? Isn’t that what EQA is for?
Well, you would be right.
Yes, EQA does provide a comparison with your peer group, but it doesn’t have exclusive rights.
There are many benefits to comparing your IQC data with your peer group. The real-time comparison data aids with troubleshooting, or you can show off how great you are to your friends and colleagues.
You can select your peer group for an instrument, method and more, providing you with a comprehensive picture of how your laboratory performance compares to your peers using the same lot of control.
There are no submission deadlines. One less thing for you to worry about.
Still think it sounds too good to be true?
Then let’s look at some of the software features and how they can be used to make your daily QC data management easier.
Charts
For many laboratories, review of their QC data is a momentous task involving an abundance of printouts with different data tables and graphs and hastily scribbled notes going back maybe months, if not years.
With Acusera 24.7’s interactive Levey-Jennings charts, you can see the QC data from a specified date range. This helps visualise trends and biases over any period to simplify the troubleshooting and lot validation processes, or, can be used as evidence during accreditation assessments. These charts can be generated for a single analyte or for multiple analytes and QC levels.
You can also add events to the graph to record factors that might impact the performance of your analyser such as preventive maintenance, calibrations or switching QC lots. So, when you come to review the QC data and see a shift in the results, you can see at a glance if there was an explanation for the change in QC results.
What’s more, the points plotted on the chart will appear in orange or red if they trigger your alert or reject protocols respectively. Those that appear as a triangle indicate a comment is attached. Comments can be added to any data point directly on the Levey-Jennings chart, allowing you to record any information relevant to the data, saving you time, not to mention the cost of all those sticky notes.

This complements the Panel feature of the software. Within Acusera 24.7 you can create a panel of tests, for example, a Liver Function Test panel, grouping all the tests together. You can then view all the QC data for this panel at the click of a few buttons. Shown below is the collective data for a clinical chemistry panel.
When you do need the paper copy, all the charts and reports found in Acusera 24.7 can be exported to Excel or PDF for independent analysis or printing, making it easy to bring your data to meetings or for hardcopy filing and audits.
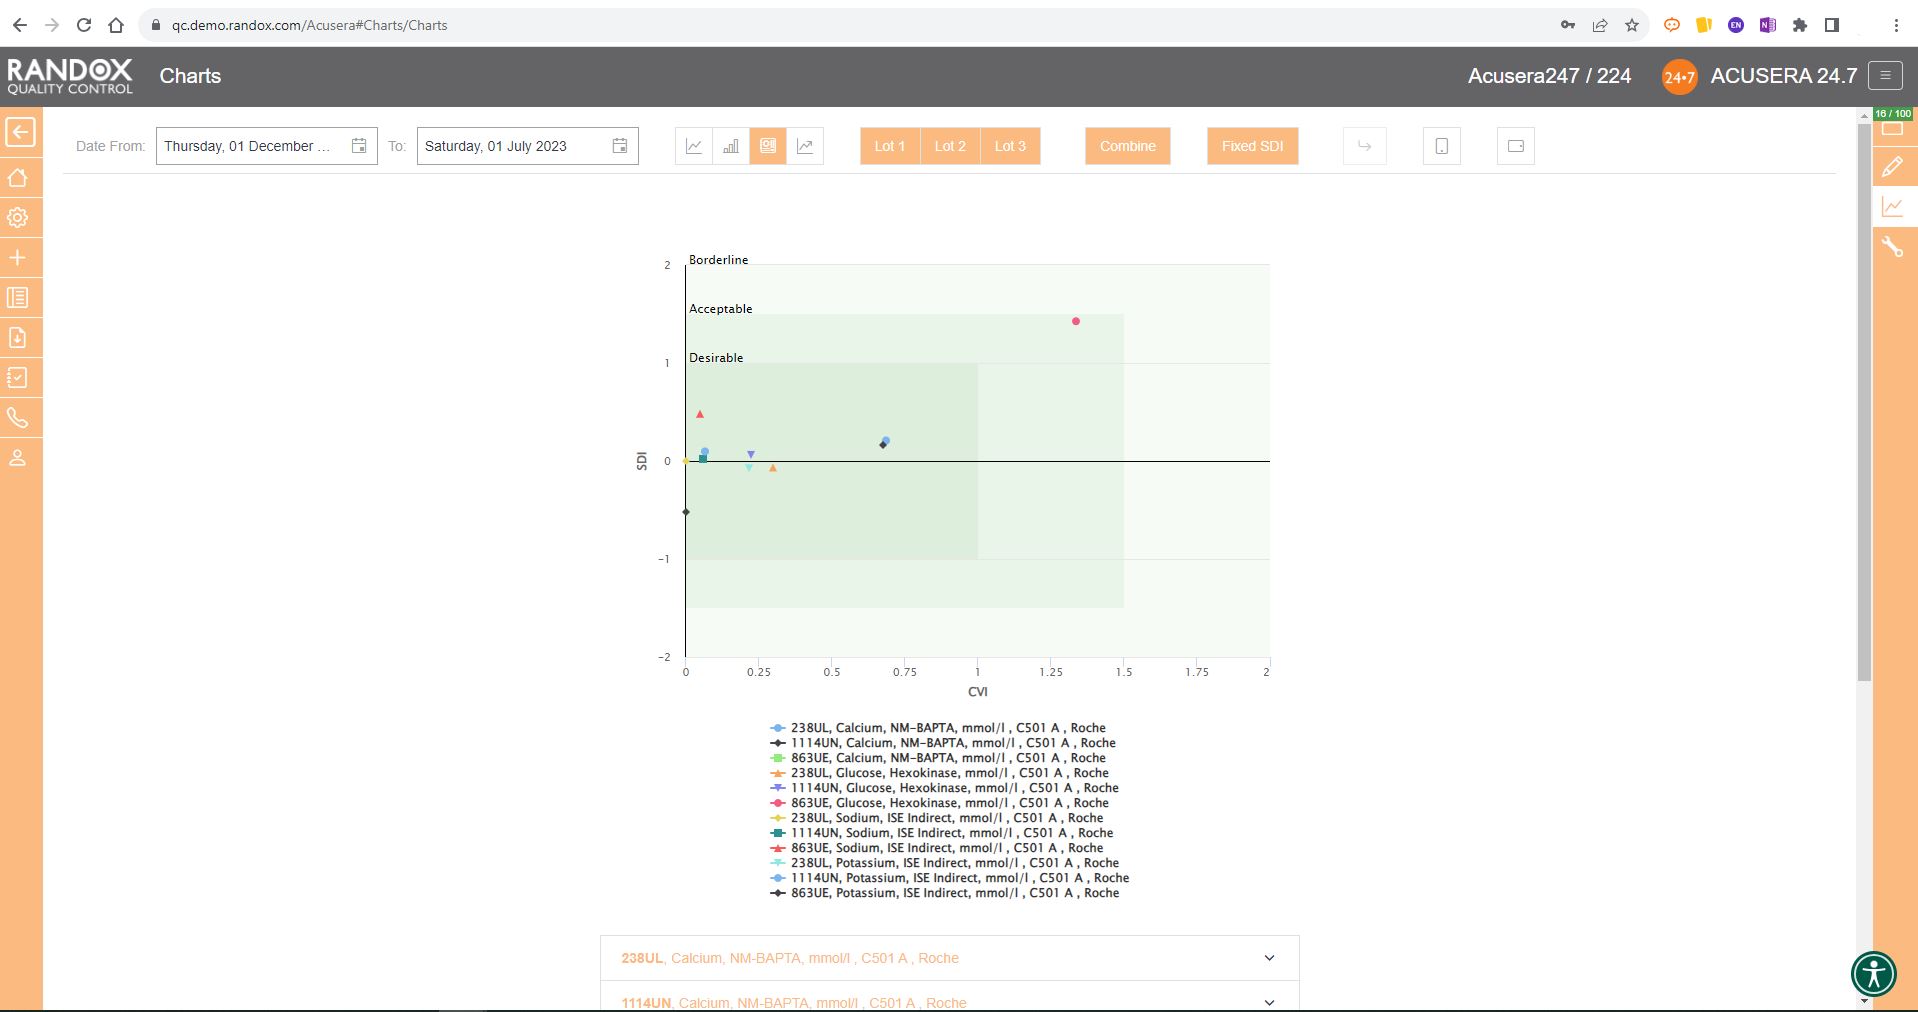
For peer group comparison, you can get a performance summary chart. This chart basically does the analysis for you! You define the date and time range, and the software looks at all the data points within it for you and your peer group, comparing individual data, means, CVs and SDs. Like our other charts, you can combine any number of these for multi-analyte analysis.
Advanced Statistics
Some people love statistics. Others can think of nothing worse.
Either way, there’s a lot of work involved in advanced statistical analysis.
Even if you’re in the love camp, you might find yourself sickened before you’ve finished this metaphorical jar of marmite.
The role of a pathology laboratory is not to run QC and show off their statistical skills, but to provide accurate and appropriate patient results.
As the old saying goes, time is money.
But in your case, time is the difference between a fast or delayed diagnosis for a patient.
This may impact their condition or treatment.
By making use of the suite of statistical options included in Acusera 24.7, including QC Multi-rules, 6Sigma and Uncertainty of Measurement, you can focus on providing the most accurate and efficient testing for patients.
Data Entry
To save even more time, Acusera 24.7 can be integrated with many LIMS or Middleware packages for fully automated data transfer. At a predefined time, your internal software will send your QC data to a shared folder on your network and from there to a Randox Cloud IP address, meaning we don’t go into your IT system and take anything; we won’t cause any information security problems. This data is then taken from the cloud and populated onto 24.7.
All this in less time than it takes you to say, ‘fully automated data transfer.’
You can also import your data through a semi-automated upload procedure. For this, the data is exported from your LIMS or middleware and imported manually to your Acusera 24.7 account using an EDI import file. Simply put, all you have to do is send the file, and the software will populate it onto the system. Alternatively, you can upload the data manually on the simple and intuitive data entry page.
Acusera 24.7, while comprehensive and initially daunting due to its vast array of features, is incredibly easy to use. The Acusera 24.7 and QC operations teams are always eager to help new and existing Acusera 24.7 users with any issues they experience. We provide complete onboarding assistance and full training on the software for new customers while delivering prompt and effective customer support for existing users.
We’ve only begun to cover the range of features available on Acusera 24.7 for QC data management! For more information or to arrange a demo, get in touch with our team at marketing@randox.com. Or, you can take a look at our website here.
Differentiating Viral from Bacterial Infections
Estimates claim that over 1.2 million people died in 2019 as a direct result of an antibiotic-resistant bacterial infection. Statistics show that up to 4.95 million deaths in the same year were associated with antimicrobial resistance (AMR)1. The overuse and misuse of antibiotics is considered to be the largest contributing factor to the rise of AMR. Antibiotics are effective at treating a wide range of bacterial infections, however, when used to treat viral infections, they have little to no effect. Even still, many physicians continue to prescribe so-called empirical antibiotics as an all-encompassing treatment strategy. In their defence, differentiating viral from bacterial infections can be troublesome. Traditional testing takes the form of paired serology, which requires patients to visit a healthcare facility twice during a 2–4-week period. Many of these infections have distressing symptoms, making this an unreasonable time-to-diagnosis period. Novel molecular techniques can reduce the time to result in the determination of many infections. However, some of these methods are associated with high false positive rates and low specificity resulting in further misuse of antibiotics.
Mxyovirus resistance protein A (MxA) is a biomarker associated with viral infections. It displays antiviral activity against positive, double-stranded RNA viruses and some DNA viruses2. In a study from earlier this year, MxA was used to differentiate viral from bacterial infections in a cohort of 61 adults with an AUROC of 0.9 and a sensitivity and specificity of 92.3% and 84.6% respectively3. An additional study, known as the TREND study, found that a cut-off of 430μg/L could effectively differentiate bacterial and viral infections with an AUROC of 0.9, a sensitivity of 92% and a specificity of 100%4.
C-reactive protein (CRP) is a non-specific acute phase protein which is associated with bacterial infection. However, CRP levels have also been shown to be elevated in response to various viral infections such as Influenza virus, malaria5 and SARS-COV-26, limiting its utility in differentiating the aetiology of an infection.
Using both biomarkers in combination can help physicians determine the true aetiology of infection with high specificity, supporting antimicrobial stewardship and reducing the harmful use of these drugs. Available on the VeraSTAT, Randox provides tests for MxA and CRP, which together provide a fast and accurate method of detection and differentiation of bacterial and viral infections from a small sample.
Alternatively, don’t hesitate to browse our range on our website or get in touch with one of our team at marketing@randox.com who will be happy to help with any query you have!
References
- Murray CJL, Ikuta KS, Sharara F, et al. Global burden of bacterial antimicrobial resistance in 2019: a systematic analysis. The Lancet. 2022;399(10325):629-655. doi:10.1016/S0140-6736(21)02724-0
- Liao S, Gao S. MxA: a broadly acting effector of interferon-induced human innate immunity. Visualized Cancer Medicine. 2022;3:2. doi:10.1051/vcm/2022002
- Metz M, Gualdoni GA, Winkler HM, et al. MxA for differentiating viral and bacterial infections in adults: a prospective, exploratory study. Infection. Published online February 3, 2023. doi:10.1007/s15010-023-01986-0
- Rhedin S, Eklundh A, Ryd-Rinder M, et al. Myxovirus resistance protein A for discriminating between viral and bacterial lower respiratory tract infections in children – The TREND study. Clinical Microbiology and Infection. 2022;28(9):1251-1257. doi:10.1016/j.cmi.2022.05.008
- Joseph P, Godofsky E. Outpatient Antibiotic Stewardship: A Growing Frontier—Combining Myxovirus Resistance Protein A With Other Biomarkers to Improve Antibiotic Use. Open Forum Infect Dis. 2018;5(2). doi:10.1093/ofid/ofy024
- Paranga TG, Pavel-Tanasa M, Constantinescu D, et al. Comparison of C-reactive protein with distinct hyperinflammatory biomarkers in association with COVID-19 severity, mortality and SARS-CoV-2 variants. Front Immunol. 2023;14. doi:10.3389/fimmu.2023.1213246
Pursuing Perfection: Insights into Global IQC Practices
In a time when medical laboratory personnel are pushed to their limits, internal quality control and quality management are easy to consider a nuisance. However, these processes are vital to ensure accuracy and precision in the potentially life-saving tests performed in these laboratories. Most High-to-middle-income countries have strict regulations governing quality procedures in medical laboratories, but global standardisation in these areas is lacking. Over 70% of clinical decisions are based on laboratory testing but many clinicians are unaware of the accuracy and precision limitations associated with many of these tests. This places the responsibility on laboratory staff to ensure that all results provided to clinical decision-makers are as true as possible. For this, they rely on IQC and a robust quality management system.
To determine the state of the industry, a report by the International Federation of Clinical Chemistry and Laboratory Medicine (IFCC) Task Force on Global Laboratory Quality (TF-GLQ) surveyed over 100 IFCC full and affiliate members, receiving responses from 46 countries1. This survey consisted of a series of multiple-choice questions in relation to quality practices in their respective countries.
Findings by IFCC Task Force on Global Laboratory Quality
90% of respondents indicated that quality standards are in use in their country, despite being mandatory in only 46.7% of those countries.
These responses are encouraging showing that at least some level of predefined QC practice is implemented even in countries that do not legislatively mandate the inclusion of quality standards. This also hints that in those countries where it is not mandatory, it may soon become a requirement to adhere to a specified QC system. Nevertheless, in countries where regulatory measures are currently absent, the rigour of the implemented quality control procedures may not be adequate to ensure the accurate reporting of results.
42.5% of respondents indicated that IQC was not run in all laboratories in their country.
These respondents indicated that IQC is run in 50-99% of laboratories in their country. This less encouraging result shows that minimum IQC practices are not implemented globally. However, due to the multiple-choice nature of this survey, it is difficult to determine how drastic this issue is. Although it does raise the question of how these laboratories verify the precision of their results.
66.7% of respondents indicated that they use assay manufacturer quality control material.
This refers to first party quality control materials which are optimised by the manufacturer for use with a specific assay, instrument or method. These controls are often manufactured from the same material as the calibrator, making them less sensitive to subtle changes in performance, allowing them to mask weaknesses in the assay in question and therefore should be considered less effective options than third-party controls. Additionally, ISO15189:2022 encourage the use of third-party controls and require laboratories seeking accreditation that do not use third party controls to provide a sufficient explanation as to why this is the case.
60% of respondents indicated that not all laboratories in their country had written IQC policies and procedures.
This highlights an important aspect of a quality management system. Without written IQC policies and procedures it is almost impossible to standardise the IQC process and corrective action across laboratory staff, never mind on a national scale. Drafting this documentation can be cumbersome, however, many organisations can be contracted to assist with the drafting and implementation of these procedures for laboratories seeking to gain accreditation.
28.6% of respondents reported that manual interpretation of the IQC data was normal practice.
Manual data interpretation also poses challenges to the standardisation of IQC processes. Written IQC policies and procedures are crucial in implementing standard acceptance criteria for IQC results. Manual data interpretation also implements restrictions on the ability to carry out more advanced statistical analysis of the QC data.
Discussion
The implementation of robust IQC practices is crucial for ensuring the trueness and precision of the results produced by a laboratory. Used correctly, IQC can monitor variability caused by instrumentation and lot changes as well as various other sources of analytical error. ISO15189:2022 provides a thorough framework for designing rigorous IQC policies and procedures, highlighting key areas such as the use of third party QC material, levels of QC material, the frequency at which IQC should be completed, matrix composition, acceptance/rejection criteria and non-conformance procedures. For more information on ISO15189:2022 accreditation, take a look at our educational guide ISO15189:2022 Updates.
The results from this survey conducted by IFCC show a clear disparity between IQC processes around the globe, displaying differences in requirements, recommendations, and legislation. Standardisation of IQC is not without its challenges. However, by striving to achieve the highest possible levels of quality, and following the guidance laid out in ISO15189:2022, laboratories can be confident in the results they provide to clinicians.
Acusera Quality Control
The Acusera range offers unbiased, independent third party quality controls for medical and research laboratories of all shapes and sizes. Our assayed controls are provided with target values for most commercially available analysers, ensuring that your test menu will be covered. With enhanced stability, commutability and consolidation, all our controls are manufactured to provide a clinically relevant challenge to your test method, aiding in ISO15189 accreditation. For more specialist laboratories, our teams are happy to discuss your requirements and help to provide bespoke quality control material, providing an extremely flexible QC range.
Acusera 24.7
Designed for use with the Acusera range of third party controls, the Acusera 24•7 software will help you monitor and interpret your QC data. Access to an impressive range of features, including interactive charts, the automatic calculation of Measurement Uncertainty & Sigma Metrics and live peer group data generated from our extensive database of laboratory participants, ensures Acusera 24•7 is the most comprehensive package available. For laboratories performing manual review of their IQC data, Acusera 24•7 provides a comprehensive yet easy-to-use platform for advanced statistical analysis and monitoring of these data.
For more information on our Acusera range of IQC material, or Acusera 24•7, feel free to reach out to us at marketing@randox.com or alternatively, browse our range of literature at the QC Resource Hub
References
- Wheeler SE, Blasutig IM, Dabla PK, et al. Quality standards and internal quality control practices in medical laboratories: an IFCC global survey of member societies. Clinical Chemistry and Laboratory Medicine (CCLM). 2023;0(0). doi:10.1515/cclm-2023-0492
RX Imola: Inflammatory Biomarkers in COVID-19
Over the course of human history, few events have had such a dramatic impact as the COVID-19 pandemic. According to the World Health Organization (WHO), as of 12th July 2023, the SARS-CoV-2 virus has claimed almost 7 million lives and figures continue to rise1. While many who become infected are only subject to mild symptoms, those who develop a more severe form of the infection are encumbered with a debilitating flu-like condition, often requiring days, if not weeks of bed rest. In a paper from June 20232, the Rx Imola was used to study C reactive protein concentrations, along with other biomarkers, in mild and severe COVID-19 patients in order to develop novel risk stratification methods for this potentially life-threatening viral infection.
The impact on healthcare services around the world cannot be understated. In developed countries, access to services for both COVID-related and other conditions took a catastrophic hit. In low-to-middle-income countries, the impact has been even more distressing, all but eliminating basic medical care in favour of combating COVID-19, partly due to inferior resources and facilities3.
In times of medical emergency, it is crucial to have an efficient and effective means of stratifying the risk to patients and a process for suitably categorising those into the least and most at risk of severe complications or death. Due to the rate at which COVID-19 spread, unfortunately, the world lacked these mechanisms for SARS-CoV-2, resulting in mass hospital overpopulation, cancelled appointments for other life-threatening conditions and ultimately the staggering mortality statistics we’ve been bombarded with since January 2022. This prompted an unprecedented surge in medical research and major advances in testing capabilities, giving us new methods of detecting SARS-CoV-2 and determining the risk posed to individuals.
One such investigation, by Paranga et al., (2023) studied a total of 13 biomarkers to determine which could accurately differentiate mild, moderate, and severe cases and identify biomarkers which were good predictors of fatality2. C reactive protein (CRP) was the best-described biomarker relating to COVID-19 throughout the pandemic. This paper compares it to 12 other biomarkers including suPAR, sTREM-1, ferritin, MCP-1 and Lactate dehydrogenase. Of these, it was discovered that CRP was clearly the most effective biomarker for differentiating mild from severe cases, with concentrations in those with severe infection being, on average, 45% higher than in those with mild symptoms2. Additionally, the authors discovered that CRP levels were not significantly affected by age, a factor known to affect the inflammation and immune responses, providing a powerful and inclusive risk stratification tool. Some of the additional conclusions drawn from this paper can be seen below2:
- Lactate dehydrogenase, sTREM-1 and HGF were good predictors of mortality in COVID-19.
- suPAR was identified as a crucial molecule in characterising Delta variant infection and mortality.
- The initial values of inflammatory biomarkers were good to excellent predictors of disease severity in COVID-19 patients.
- Disease severity and mortality are associated with a higher rate of comorbidities including thrombocytopenia and other blood diseases, circulatory and respiratory system diseases and liver diseases such as cirrhosis.
So, what is CRP and how does it become elevated in response to a SARS-CoV-2 infection? CRP is a non-specific, acute-phase protein, meaning its concentration is altered in response to inflammation4. The acute respiratory distress syndrome induced by SARS-CoV-2 is, in part, a result of the hyperinflammation caused by the virus2. CRP is a well-characterised inflammatory biomarker and is therefore well-suited for identification and risk stratification in an emerging disease.
This investigation2 utilised the RX Imola, a rapid, comprehensive clinical chemistry platform, to quantify CRP. With the RX Imola, laboratories can gain access to the world’s largest clinical chemistry test menu covering routine chemistries as well as specific proteins, lipids, and more providing a cost-effective and user-friendly platform. With 60 cooled reagent positions and a sample carousel with 20 cooled positions for controls and calibrators, the RX Imola is an ideal solution for small to medium-throughput laboratories seeking an innovative and reliable clinical chemistry system. Randox also supplies suitable, high-quality reagents, and through Acusera, state-of-the-art controls and calibrators, completing the clinical chemistry portfolio.
References
1. World Health Organisation. WHO Coronavirus (COVID-19) Dashboard. https://covid19.who.int/.
2. Paranga TG, Pavel-Tanasa M, Constantinescu D, et al. Comparison of C-reactive protein with distinct hyperinflammatory biomarkers in association with COVID-19 severity, mortality and SARS-CoV-2 variants. Front Immunol. 2023;14. doi:10.3389/fimmu.2023.1213246
3. Jain P. Impact of COVID-19 Pandemic on Global Healthcare Systems and the role of a new era of global collaborations. Sushruta Journal of Health Policy & Opinion. 2021;14(3):1-5. doi:10.38192/14.3.2
4. Nehring S. C Reactive Protein . https://www.statpearls.com/articlelibrary/viewarticle/18744/.
ADLM 2024
At the Forefront of the Diagnostics Industry
With more than forty years of expertise in the medical diagnostics field, Randox is committed to improving global health outcomes. Renowned for its high-quality diagnostic solutions, Randox provides an extensive array of products and services, including Quality Control, Molecular Diagnostics, Third Party Reagents, Point of Care, and Clinical Chemistry Analysers.

Pushing Innovation to the Limits
At Randox, innovation is our cornerstone. Our recent release of Acusera SMART exemplifies our dedication to advancing medical diagnostics. This development integrates seamlessly with various test systems, streamlining the QC process by reducing human error and optimising workflow. Additionally, we’ve launched new Acusera Quality Controls, including active B12, serum indices, and ultra-low PSA, along with comprehensive panels on our MultiStat platform, now expanded to include gastrointestinal diseases, bladder cancer, and male and female hormones. These advancements ensure accurate and reliable diagnostic results, reflecting our commitment to delivering cutting-edge solutions for the evolving healthcare industry.
Learn more about the products we will be showcasing by clicking on the images to the left.

Dedicated to Improving Health Worldwide
With over four decades of experience in the medical diagnostics industry, Randox is dedicated to enhancing global health outcomes. As a provider of high-quality diagnostic solutions, Randox offers a wide range of products and services, including Quality Control, Molecular Diagnostics, Third Party Reagents, Point of Care, and Clinical Chemistry Analysers.

Acusera Quality Controls
Introducing the New Acusera True Third Party Controls. Book a meeting with a Randox QC Specialist today to learn how we can provide you with complete QC solutions for results you can trust.

Molecular Diagnostics at the Point of Care
The all in one molecular solution developed by Bosch and Randox consolidates full molecular workflow into one small benchtop platform. Randox multiplex Biochip Technology powers the Vivalytic enabling multiple results from one patient sample. Click the link below to learn more about the Vivalytic.

ACUSERA 24•7 Interlaboratory Data Management
Discover features such as; Interactive Levey-Jennings Charts, Automatic Calculation for uncertainty of Measurement as well as the Comprehensive Reports generated on demand, with a live demonstration at EuroMedLab.

RIQAS
The world’s largest External Quality Assessment Scheme with more than 55,000 laboratory participants spanning over 134 countries. Choice and flexibility are guaranteed with our 36 programme portfolio, learn more by clicking the button below!

Contract Manufacturing
At Randox, we are dedicated to helping you bring your diagnostic and life science products to market with unparalleled expertise, capacity, and commitment to quality. With over 40 years of experience and a network of over 300 global customers, our comprehensive OEM and contract manufacturing services cover the entire value chain, from concept development to full commercialisation.
Meet The Team
If you plan to attend ADLM 2024, our Product Specialists Team will be available at Booth #1413 to answer any questions you may have. To ensure the most productive use of your time, we recommend scheduling a meeting with one of our Randox representatives in advance to discuss your specific needs and book a time slot during the event.
Worldlab∙Euromedlab 2023
We will be exhibiting at Worldlab∙Euromedlab 2023!
We invite you to stop by RCC La Nuvola in Rome between May 21st and May 25th, 2023 for a visit.
Make sure to drop by Booth #153, where we’ll be engaging in conversations about cutting-edge diagnostic products and solutions, while also showcasing our groundbreaking technologies.
With over four decades of experience in the medical diagnostics industry, Randox is dedicated to enhancing global health outcomes. As a provider of high-quality diagnostic solutions, Randox offers a wide range of products and services, including Quality Control, Molecular Diagnostics, Third Party Reagents, Point of Care, and Clinical Chemistry Analysers.

Meet The Team
If you plan to attend Worldlab∙Euromedlab 23, our Product Specialists Team will be available at Booth #153 to answer any questions you may have. To ensure the most productive use of your time, we recommend scheduling a meeting with one of our Randox representatives in advance to discuss your specific needs and book a time slot during the five-day event by clicking on the button below:
VeraSTAT – Enquiry
Excellence at the point of care, with accurate results in minutes

Rheumatoid Factor: The Most Remarkable Autoantibody in Rheumatoid Arthritis
Rheumatoid Factor:
The Most Remarkable Autoantibody in Rheumatoid Arthritis
Celebrating World Arthritis Day (WAD)
Rheumatoid Factor: The Most Remarkable Autoantibody in Rheumatoid Arthritis
World Arthritis Day (WAD) is celebrated on 12th October to help raise global awareness of the existence and impact of rheumatic and musculoskeletal diseases (RMDs). It is estimated that over one-hundred million people are currently undiagnosed impacting their quality of life and participation in society – including their ability to work and lead a normal life. As a result this increases dependency on state welfare, the healthcare system and the required support from their family and friends.
The European League Against Rheumatism (EULAR) launched the ‘Don’t Delay, Connect Today’ campaign focusing on the importance of early diagnosis and access to care.
Randox Reagents fully supports the importance of early diagnosis – to aid in the early implementation of effective treatment plans, aiding in improved health outcomes – it’s the ethos of our business. This blog delves deeper into rheumatoid factor (RF), the most remarkable autoantibody in rheumatoid arthritis.
Pathobiology of Rheumatoid Arthritis (RA)
The pathophysiology of RA involves various signaling pathways and immune modulators (effector cells and cytokines) as indicated in figure 1. Joint destruction is caused by the intricate interactions of immune modulators, beginning at the synovial membrane and encompassing most IA structures, with synovitis caused by both or individually, the local activation or influx of mononuclear cells, including: B cells, T cells, dendritic cells, plasma cells, mast cells and macrophages. Consequently, “the synovial lining becomes hyperplastic, and the synovial membrane expands and forms villi”. The neutrophils, chondrocytes and synoviocytes secrete enzymes that degrades the cartilage in the joint whereas the osteoclast-rich area of the synovial membrane destroys the bone 4.
Rheumatoid arthritis (RA), “the most common systemic inflammatory autoimmune disease” affecting 1% of the global population, is characterised by fatigue, synovial joint pain, stiffness, swelling and destruction, with severe symptoms resulting in disability. Whilst the exact cause of RA is unknown, it is believed that genetic and environmental factors play a role in triggering the disease 2, 3. Differences in the human leukocyte antigen (HLA)-DRB1 alleles (proteins with a critical role in the immune system) have been identified as a genetic variant for RA, observed in >80% of patients, particularly in those testing positive for RF. Moreover, those with variations in the HLA-DRB1 who smoke, increase their risk of RA. As RA is more common in women (2-fold increased risk in women compared to men), hormonal influences are an area of active research, however, an inverse correlation with breastfeeding has been identified. Women who breastfeed for >13 months aids in reducing the risk of RA compared to women who have never breastfed 3, 4.
Figure 1: Schematic view of (a) a normal joint and (b) a joint affected by RA 4

Clinical Significance of Rheumatoid Factor (RF)
Interestingly, elevated levels of RF have been observed in other autoimmune conditions such as Sjögren syndrome and systemic lupus erythematosus (SLE) as well as non-autoimmune conditions including old age and chronic infections. Despite this, RF in RA patients can be distinguished from RF in healthy individuals. RF in RA patients displays affinity maturation whereas RF in healthy individuals has low affinity and are polyreactive 2.
RF is a class of immunoglobulin (Ig) autoantibodies that are directed against the fragment crystallizable region (Fc region), the tail region of the IgG antibody. In RA, RF are produced by the B cells present in lymphoid follicles and the germinal center(GC)-like structures that mature in inflamed synovium. Most RF are IgM antibodies, but may also be IgG or IgA isoforms. IgM RF are detected in 60% to 80% of RA patients. “RF testing in RA patients has a sensitivity of 60% to 90% and a specificity of 85%” (5). RF is a highly valuable biomarker in RA 5, 2.
Key Features of the Randox Rheumatoid Factor Assay
The Randox automated latex enhanced immunoturbidimetric rheumatoid factor assay provides an accurate assessment of RF titre as the Randox rheumatoid factor calibrator is standardised against the primary WHO material, 1st British Standard 64/2. With a wide measuring range of 6.72 – 104lU/ml for the comfortable detection of clinically important results, the Randox RF assay is available in a liquid ready-to-use format for the comfortable detection of clinically important results. The Randox rheumatoid factor assay does not suffer from interference from C1q complement and is stable until expiry date. With dedicated calibrator and controls for a complete testing package, Randox offer applications, detailing instrument-specific settings for the convenient use of the Randox rheumatoid factor assay on a wide range of clinical chemistry analysers.


